By Thomas O. Herrick
Chief Investment Officer, Managing Director
Stocks and bonds have begun 2023 on a high note. As we discussed at length in our 2023 Market Outlook, these two asset classes are much more highly correlated in a higher inflation dynamic, something we have not seen for decades. The SPDR S&P 500 ETF is up 6.53% YTD, and the Core US Aggregate Bond ETF is up 2.58% through the 27th of January.1
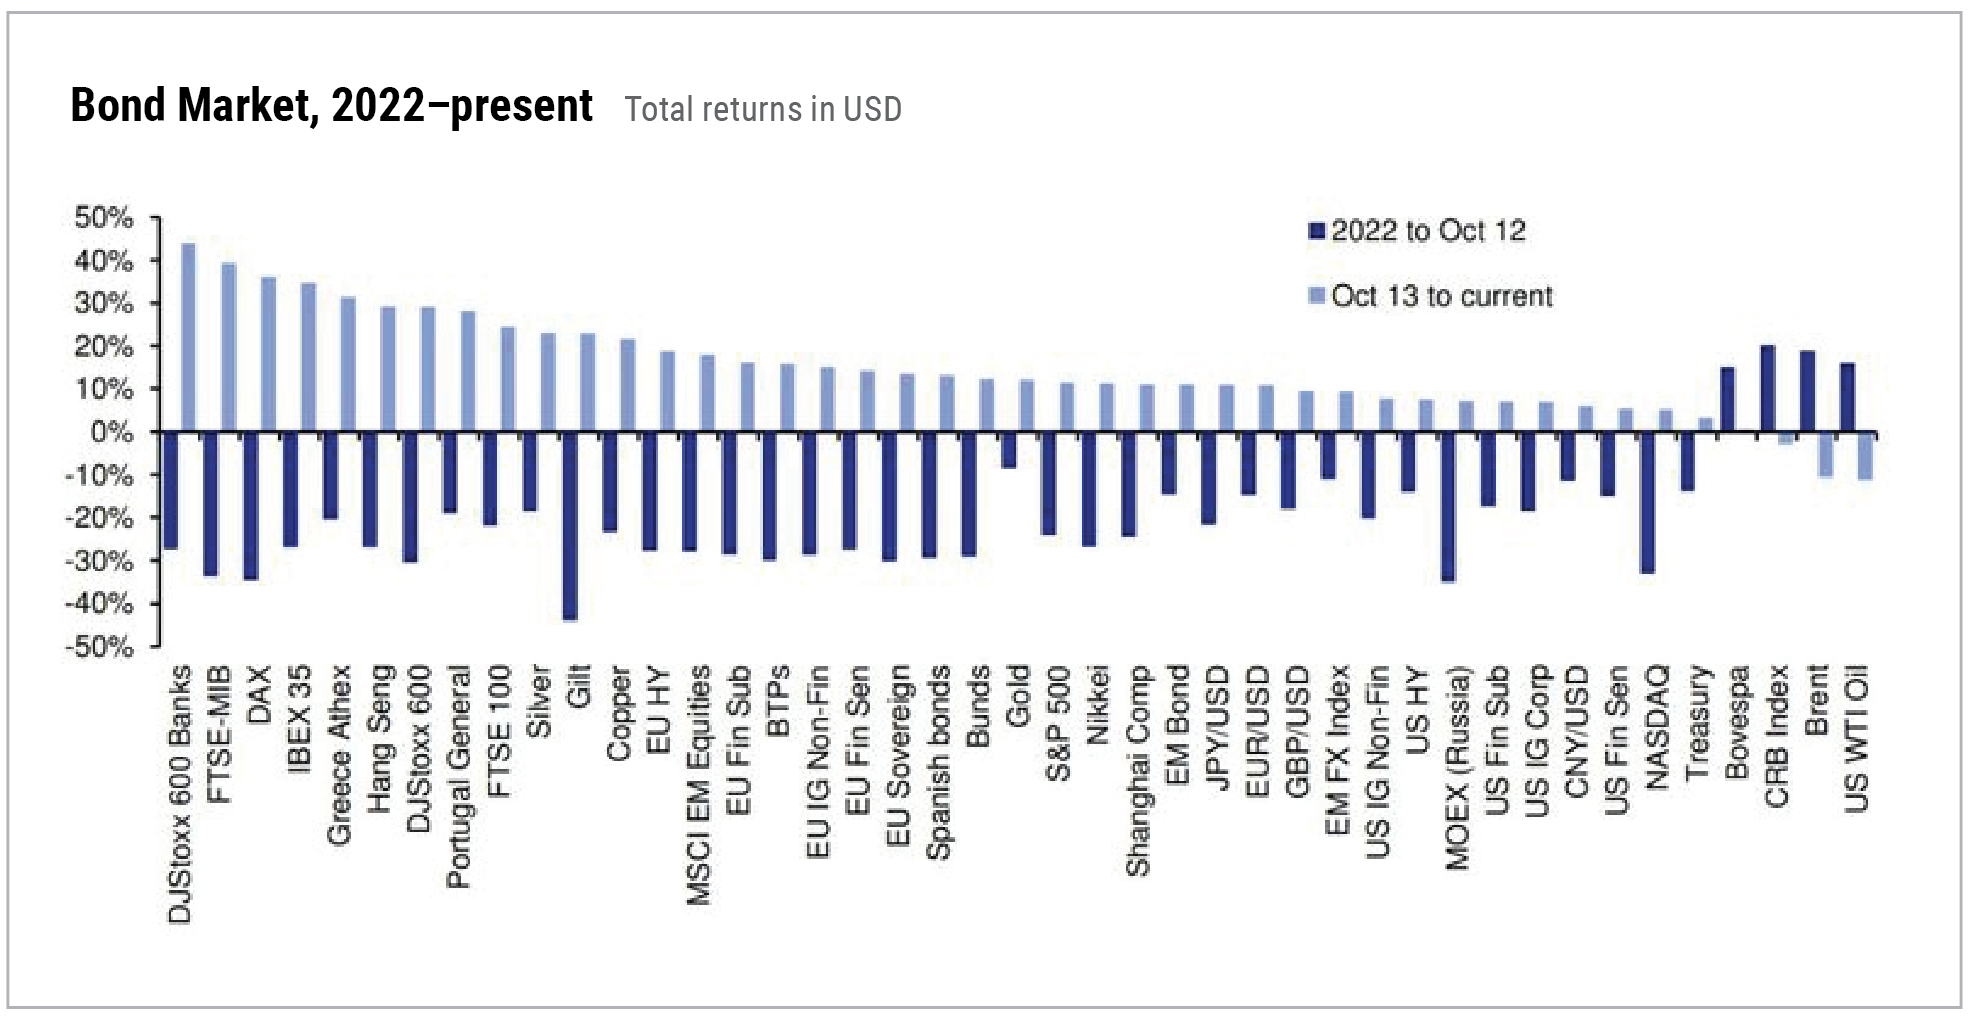
Longer-term Treasury yields are the most important price point for both bonds and stocks, directly impacting the prices of both. Yields and bond prices move opposite. Yields have been coming down since October of last year as a series of monthly CPI prints have indicated lower month-over-month inflation data. Longer duration Treasuries have appreciated nicely as a consequence. The SPDR Long Term Treasury ETF is up 5.38% YTD. Equities have also experienced a decent rally since October, led in 2023 by longer duration, growth names found in sectors such as consumer discretionary, communications, and technology. Duration, driven by lower yields, remains the key input for both stocks and bonds. Short term, the 10-year Treasury yield is likely to consolidate around the 3.5% region for a while as we have moved a long way recently and will not be seeing any inflation data until February 14th.
A Summary of 2023 Market Outlook Positioning:
- The typical 60/40 stock bond allocation comes back to life in 2023, driven by the duration trade in both highly correlated asset classes.
- Within bonds, lean into longer-duration Treasuries. Taking risk within the credit space makes no sense with spreads as tight as they are.
- Within equities, maintain a balanced exposure that includes the growth side of the market. These longer-duration names stand to be potent performers around favorable liquidity events, such as a slower pace or pause of Fed funds rate increase from the FOMC triggered by a better-than-expected inflation print. On the value side, energy remains in a very strong long-term uptrend with good relative strength.
- Longer term, look to income-generating hedge strategies for additional diversification. We have a base case for lower yields in 2023, but that is not a base case for a return to the sub 2% inflation, nothing but lower yields environment that perpetuated for a long time previous to 2021.
Calmer rates = better risk asset returns
 Source: Bloomberg Finance LP, Deutsche Bank
While admittedly not in 2023 Outlook, we would add international equity diversification to the list. The re-opening and favorable liquidity condition of China is a boost for that market as well as Asian and European equities that export into that market.
We have a base case for dis-inflation going forward. The largest driver of high inflation is money supply, which exploded in 2020 and 2021. Very loose liquidity during the pandemic was an appropriate Fed policy but continuing that response well into 2021 was a mistake that unleashed price increases not seen in decades. Fortunately, since last March the US has experienced essentially zero money supply growth which has been exerting an effect in recent improvements to CPI data. Higher prices ultimately solve higher prices through demand destruction provided those higher prices are not accommodated by too much money supply. This is classic, empirically demonstrated by Milton Friedman 101.
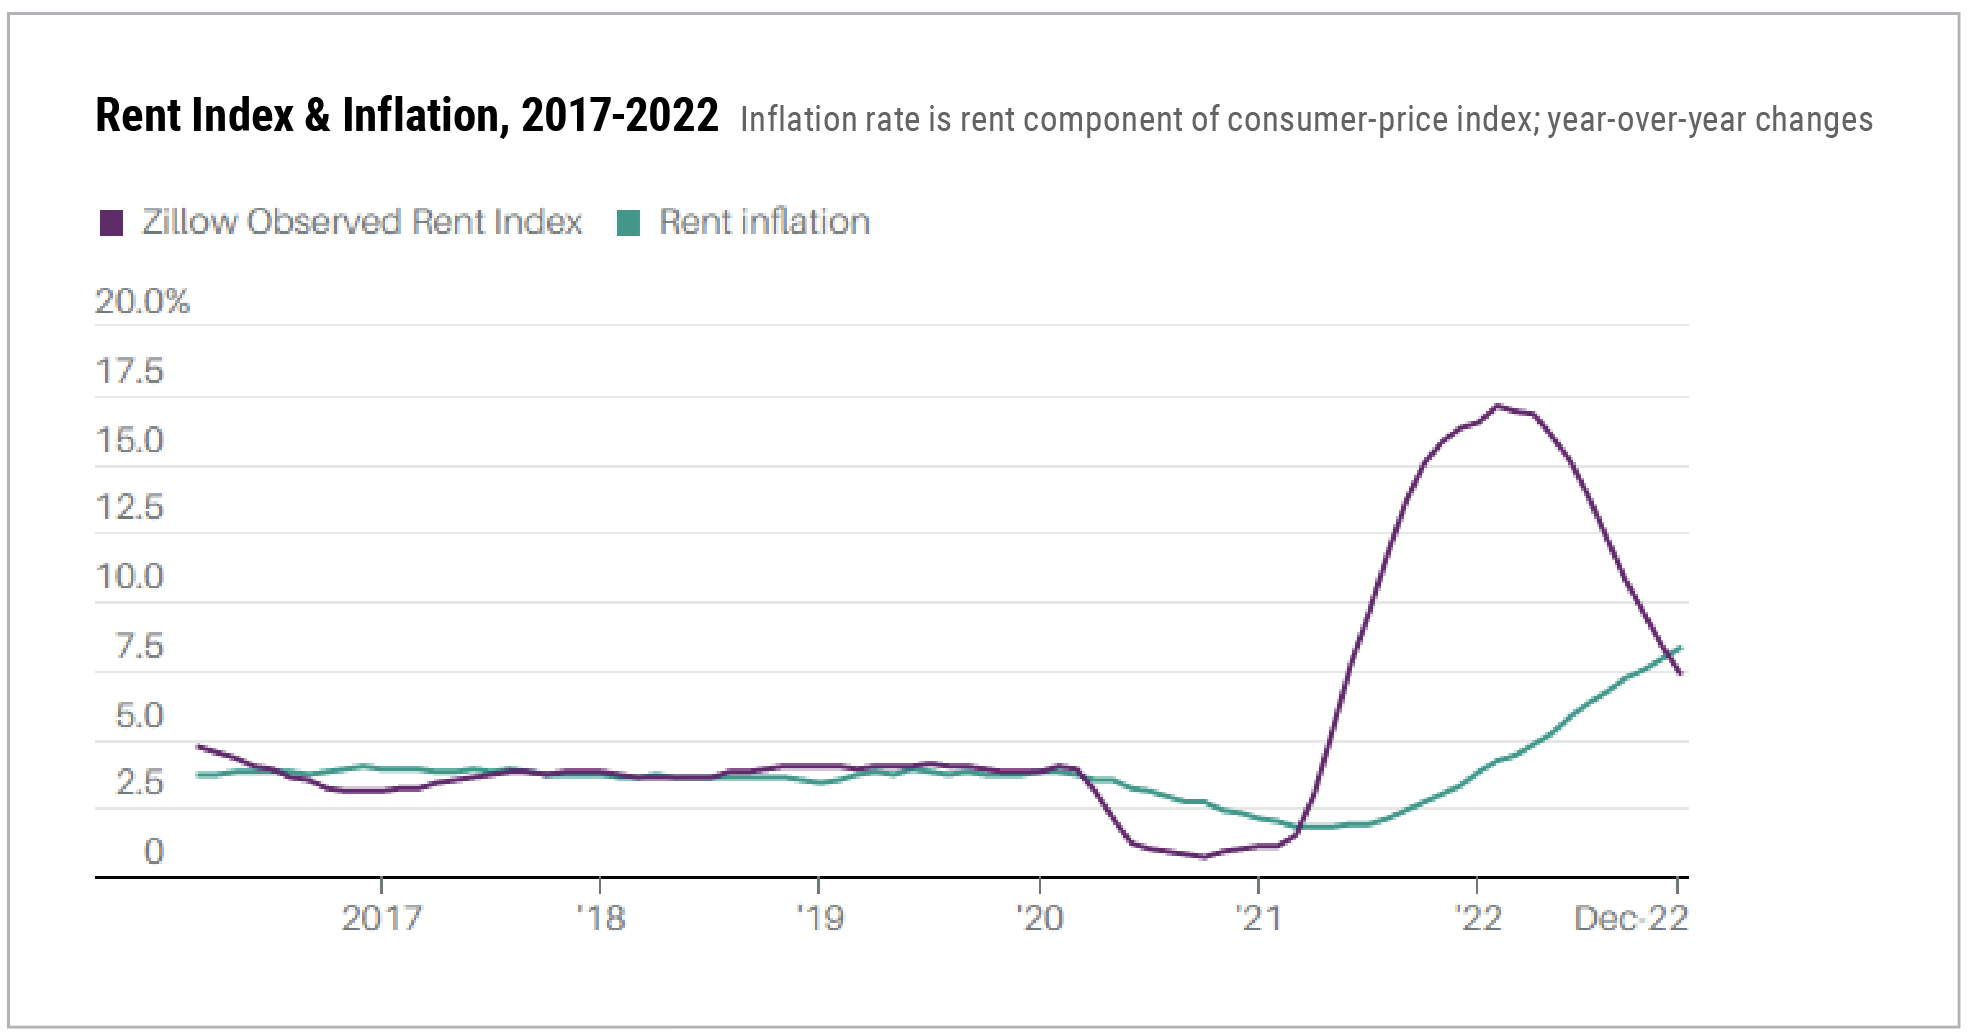
Recent downside rent data will begin to show up in monthly CPI. Weak lease activity started last fall and will take a few quarters to work into CPI calculations. This should provide additional downside pressure on month-over-month prices as rent is a very large (about 40%) and sticky component within CPI. The outcome should be CPI more in the 3 to 4% range as opposed to the current 6 to 7% range.1 Very tight labor markets are a sticky point for inflation to get down as low as 2%. In summary, a very improved inflation backdrop, but still structurally higher than in recent decades.
Smaller rent increases are not in the inflation data… yet
 Source: Zillow, Bureau of Labor Statistics
1Bloomberg
General Disclosure: Cary Street Partners is the trade name used by Cary Street Partners LLC, Member FINRA/SIPC; Cary Street Partners Investment Advisory LLC and Cary Street Partners Asset Management LLC, registered investment advisers.
Any opinions expressed here are those of the authors, and such statements or opinions may not represent the opinions of Cary Street Partners. These are statements of judgment as of a certain date and are subject to future change without notice. This information may contain future predictions that are subject to certain risks and uncertainties, which could cause actual results to differ from those currently anticipated or projected.
These materials are furnished for informational purposes only, to provide investors with an update on financial market conditions. The description of certain aspects of the market herein is a condensed summary only. Materials have been compiled from sources believed to be reliable; however, Cary Street Partners does not guarantee the accuracy or completeness of the information presented. Such information is not intended to be complete or to constitute all the information necessary to evaluate adequately the consequences of investing in any securities, financial instruments, or strategies described herein.
Cary Street Partners and its affiliates are broker-dealers and registered investment advisers and do not provide tax or legal advice; no one should act upon any tax or legal information that may be contained herein without consulting a tax professional or an attorney.
We undertake no duty or obligation to publicly update or revise the information contained in these materials. In addition, information related to past performance, while helpful as an evaluative tool, is not necessarily indicative of future results, the achievement of which cannot be assured. You should not view the past performance of securities, or information about the market, as indicative of future results.
These materials are for illustrative purposes only. Nothing contained herein should be considered a solicitation to purchase or sell any specific securities or investment related services. There is no assurance that any securities discussed herein will remain in an account’s portfolio at the time you receive this report or that securities sold have not been repurchased. The securities discussed do not represent an account’s entire portfolio and in the aggregate may represent only a small percentage of the portfolio’s holdings. It should not be assumed that any of the securities transactions or holdings discussed were, or will prove to be, profitable, or that the investment recommendations or decisions made in the future will be profitable or will equal the investment performance of the securities discussed herein. A complete list of every holding’s contribution to performance during the period and the methodology of the contribution to return is available by contacting Cary Street Partners Marketing.
CSP2023033 ©2023 CARY STREET PARTNERS LLC, All Rights Reserved.