By Thomas O. Herrick
Chief Investment Officer, Managing Director
It Turns Out the 60/40 Portfolio Was Just Mostly Dead
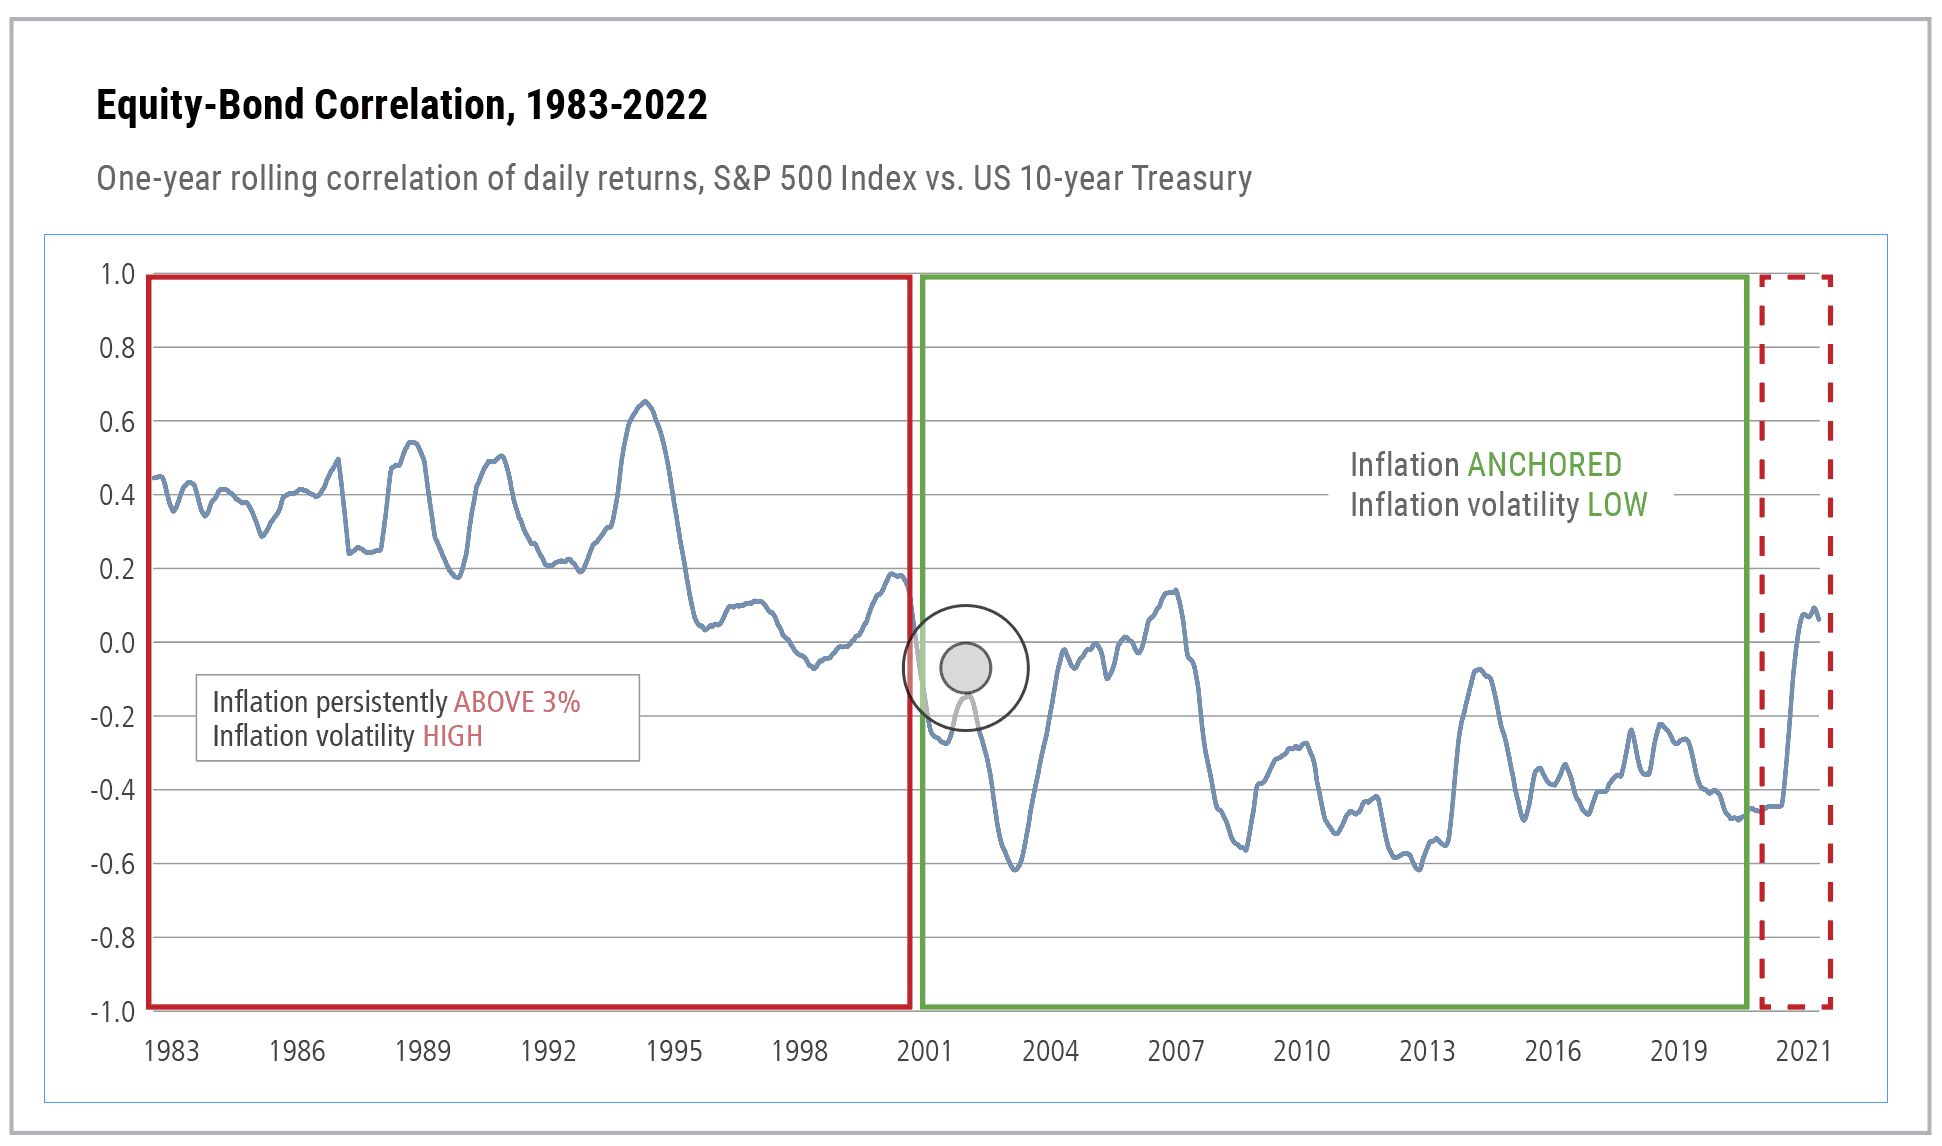
2022 resulted in one of the more difficult investment environments in recent decades. One in which both stocks and bonds suffered significant losses as the Federal Reserve attempted to play catch up to higher inflation than the Fed itself previously anticipated. As of this writing, the S&P 500 Index is down 13.26% year to date, globally the MSCI ACWI is down 14.65%, and the Bloomberg U.S. Aggregate Bond Index is down 11.44%. The drawdown of both stocks and bonds at once is not typical and posed a major challenge to the typical 60/40 stock/bond mixture that is ubiquitous among investors. Equities and bonds are much more highly correlated in a high-inflation market, as well as much more volatile. While this was a major challenge for 2022, we draw a much different conclusion for balanced account results in our 2023 forecast. With apologies to a classic movie The Princess Bride— 60/40 was just mostly dead.
It’s been a long time since we’ve seen this dynamic.
Equities spent most of 2022 fighting the Fed, never a good thing. Liquidity is the number one tactical driver of equity moves, and tightening liquidity is always a headwind. This year it was more than a headwind given the degree of work the central bank must do to correct their previous mistake of staying loose far too long into 2021. The higher structural inflation dynamic that the Fed unleashed in late 2020 and well into 2021 was triggered by massive money supply growth, resulting in CPI data we have not experienced in 40 years. Fortunately, since March, money supply growth has been zero, which bodes well for CPI data going forward into 2023. Indeed, our base case for inflation is one of month-over-month declines through the first half of next year. The housing and rent component will be a key assist to deceleration as rent pricing is falling rapidly just as massive new apartment supply hits the market. It takes some time for new lease pricing to show up in CPI given how the data is calculated but show up it will during the first half of 2023. Rent is approximately forty percent of the CPI, and in addition to being large, it is also a very sticky component. All makes for an easier time for the Fed, and we would peg mid-year 2023 CPI around 4% to 5% as opposed to recent highs around 8%.
From a market perspective, the key price going forward into 2023 is the 10-year Treasury yield. Markets typically begin to act better in a sustained way as this yield begins to reflect some light at the end of the tightening tunnel. This dynamic is already playing out to some degree as we see current 10-year yield pricing at 3.57% versus the high of 4.32% back in mid-October. This does not mean the Fed won’t continue to raise short-term Fed funds rates, they will. But historically the 10-year Treasury yield will begin to ignore the Fed as the market begins to see an endpoint to that tightening. Both equities and bonds react well to this development. As a reminder, bond price moves opposite yield. The equity rally since mid-October has come on the back of a substantially lower 10-year yield.
While we could certainly experience another pullback going into early 2023 as a counter-trend to recent equity strength, the full year of 2023 sets up well for both stocks and bonds. A higher inflation world is a rate-driven world, it is not the post-GFC world. And while we have a base case for lower inflation going forward, this is not the post-GFC inflation of sub 2%. Therefore, stocks and bonds continue to be much more highly correlated next year than they have been for some time. The tight correlation is a huge benefit to balanced account investors in 2023, inverse to be a huge negative in 2022. Yields are in charge.
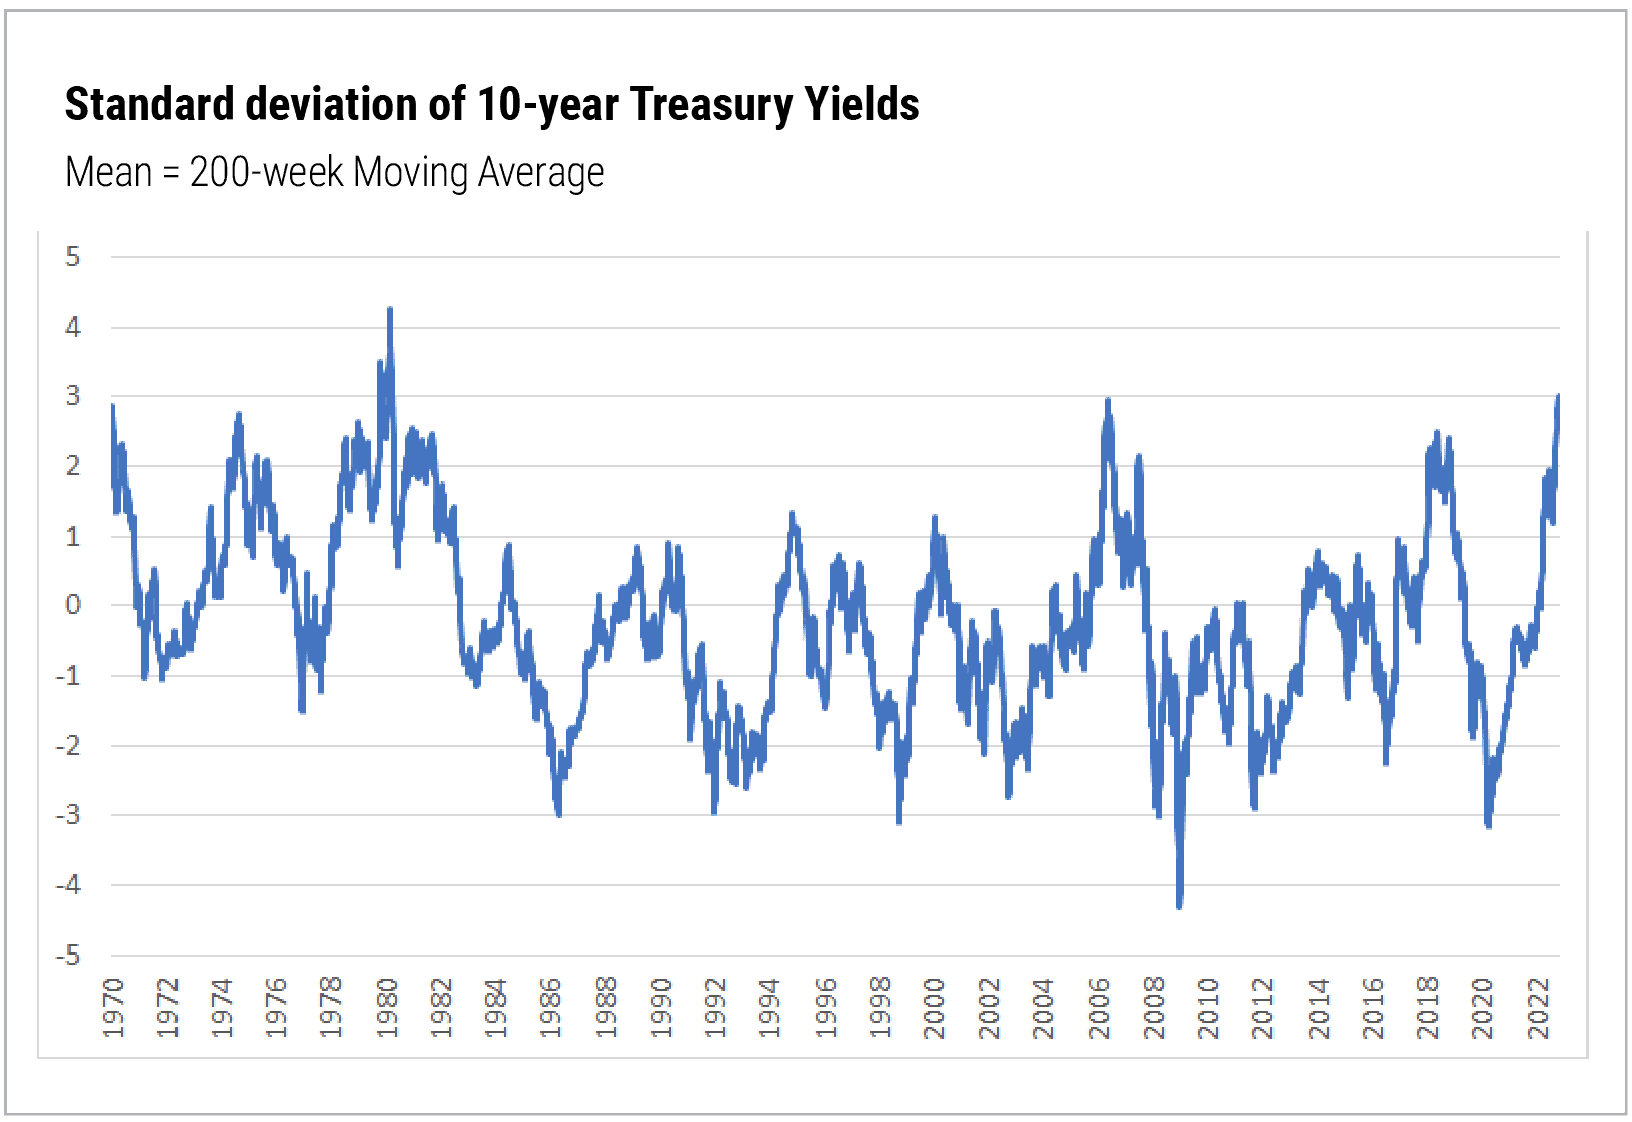
Treasury yields still close to a three standard deviation inflection point.
Positioning–The 60/40 Portfolio Comes Back to Life
1. The equity market is hyper-focused as usual on Fed intentions and is coiled to react to anything indicating light at the end of the tightening tunnel. In terms of tactics, liquidity is everything to equity markets. Look for lower month-over-month CPI data as the macro indicator that leads to sustained upside in equities.
2. Yields are in charge and the leading price point for both stocks and bonds is the 10-year Treasury yield. We are constructive on both stocks and bonds over the course of the full year 2023 but would focus bond exposure on the Treasury market, especially longer-duration maturities. There is still the possibility of further slow or negative economic growth and that could be a problem for corporate credit.
3. Within equities, relative strength still lies with sectors such as energy and health care that are typically found on the value side of the market. However, investors should not completely ignore the growth side. To do so would be ignoring the message of the market, which indicates significant upside power for longer-duration growth stocks coincident with a change in Fed policy and somewhat easier liquidity. This makes sense in the rate-driven world we inhabit. This is less of an imperative in many portfolios given that most investors have remained overweight mega-cap technology, common on the growth side, during 2022.
4. Stocks and bonds are much more highly correlated in the post-2020 dynamic of higher structural inflation. This has been brutal for 60/40 type accounts over the last year. Going forward over the next 12 months, we expect to see the opposite. A higher-than-normal return picture for balanced, 60/40 style, stock, and bond portfolios.
5. The same correlation of stocks and bonds that led to trouble this year, and likely leads to above-expectation results in 2023, will still be in place with higher structural inflation. Along with that strong correlation, volatility will be higher. That makes additional diversification into income-producing hedge strategies appropriate for many investors, particularly as we get beyond initial stock and bond rallies. These strategies limit market drawdown and volatility while still allowing for sizable market participation to the upside.
All market and economic data is sourced from Bloomberg.
Cary Street Partners is the trade name used by Cary Street Partners LLC, Member FINRA/SIPC; Cary Street Partners Investment Advisory LLC and Cary Street Partners Asset Management LLC, registered investment advisers.
Past performance is no guarantee of future results. This material has been prepared or is distributed solely for informational purposes and is not a solicitation or an offer to buy any security or instrument or to participate in any trading strategy. Any opinions expressed or implied herein are those of the authors and do not necessarily reflect the opinions of their respective firms and are subject to change without notice. Any mention of specific investments, asset classes, or market sectors are intended for general discussion and should not be misconstrued as investment advice. Investors must make decisions based on their specific investment objectives and financial circumstances. Additional information is available upon request.
The S&P 500 is an unmanaged index of common stock. Unmanaged indices are for illustrative purposes only. Investments in stocks and bonds are subject to risk, including market and interest rate fluctuations. An investor cannot invest directly in an index. Investing in commodities involves a substantial amount of risk, including loss of the entire initial investment.
CSP2022266 © Copyright 2022 CARY STREET PARTNERS LLC, All Rights Reserved.

