
By Thomas O. Herrick
Market Strategist
Over the course of the first quarter, domestic equities have struggled. The S&P 500 Index declined 3.48% in 2025 through this writing. The index peaked on February 19th and has declined about 8% from the peak, visiting correction territory. International equities have fared better, with the EAFE Index up 10.65% and the MSCI Emerging Market Index higher by 6.60%. Europe leads overseas developed markets, notably Germany, which is higher by 20.56%.
Within U.S. markets, the previously Magnificent 7, poster children of concentrated performance in 2023 and 2024, are down over 13% YTD. Rotation away from these names has been evident, and cap-weighted indexes such as the S&P 500 remain challenged as a consequence. This trend likely continues given the diminishing gap in earnings growth between Mag 7 and the remaining 493 stocks in the S&P. Beneficiaries of the post-concentration peak trend are equal weight and value strategies. Equal weight S&P has declined by .79% on a company basis and gained .67% on a sector basis. The Russell 1000 Value Index is higher by 1.53% YTD.
Bonds have performed well in 2025, as the U.S. faces a slowing economy, with high odds that GDP will be below trend this quarter. The U.S. Aggregate Index is higher by 2.55%.
Markets are challenged by two significant factors that also present opportunity.
These challenges are changes in earnings expectations among U.S. stocks and public policy uncertainty surrounding the potential imposition of widespread tariffs by the U.S.
Stocks typically rise or fall on rising or falling earnings expectations. While S&P earnings for Q4 2024 were outstanding, rising about 17%, Q1 expectations have dropped fast. At the beginning of 2025, analysts forecast more than 11% growth in Q1 earnings. The latest update from FactSet, a well-established market data provider, now has those expectations down to a 7.1% increase. This creates a stricter backdrop for cap-weighted equity averages. On a relative basis, diminished expectations should benefit sectors outside of technology, especially those more defensive in nature, such as consumer staples. Widespread tariffs would further impact earnings with an estimated 1 to 2% drag corresponding to every 5% in widespread tariff increases.
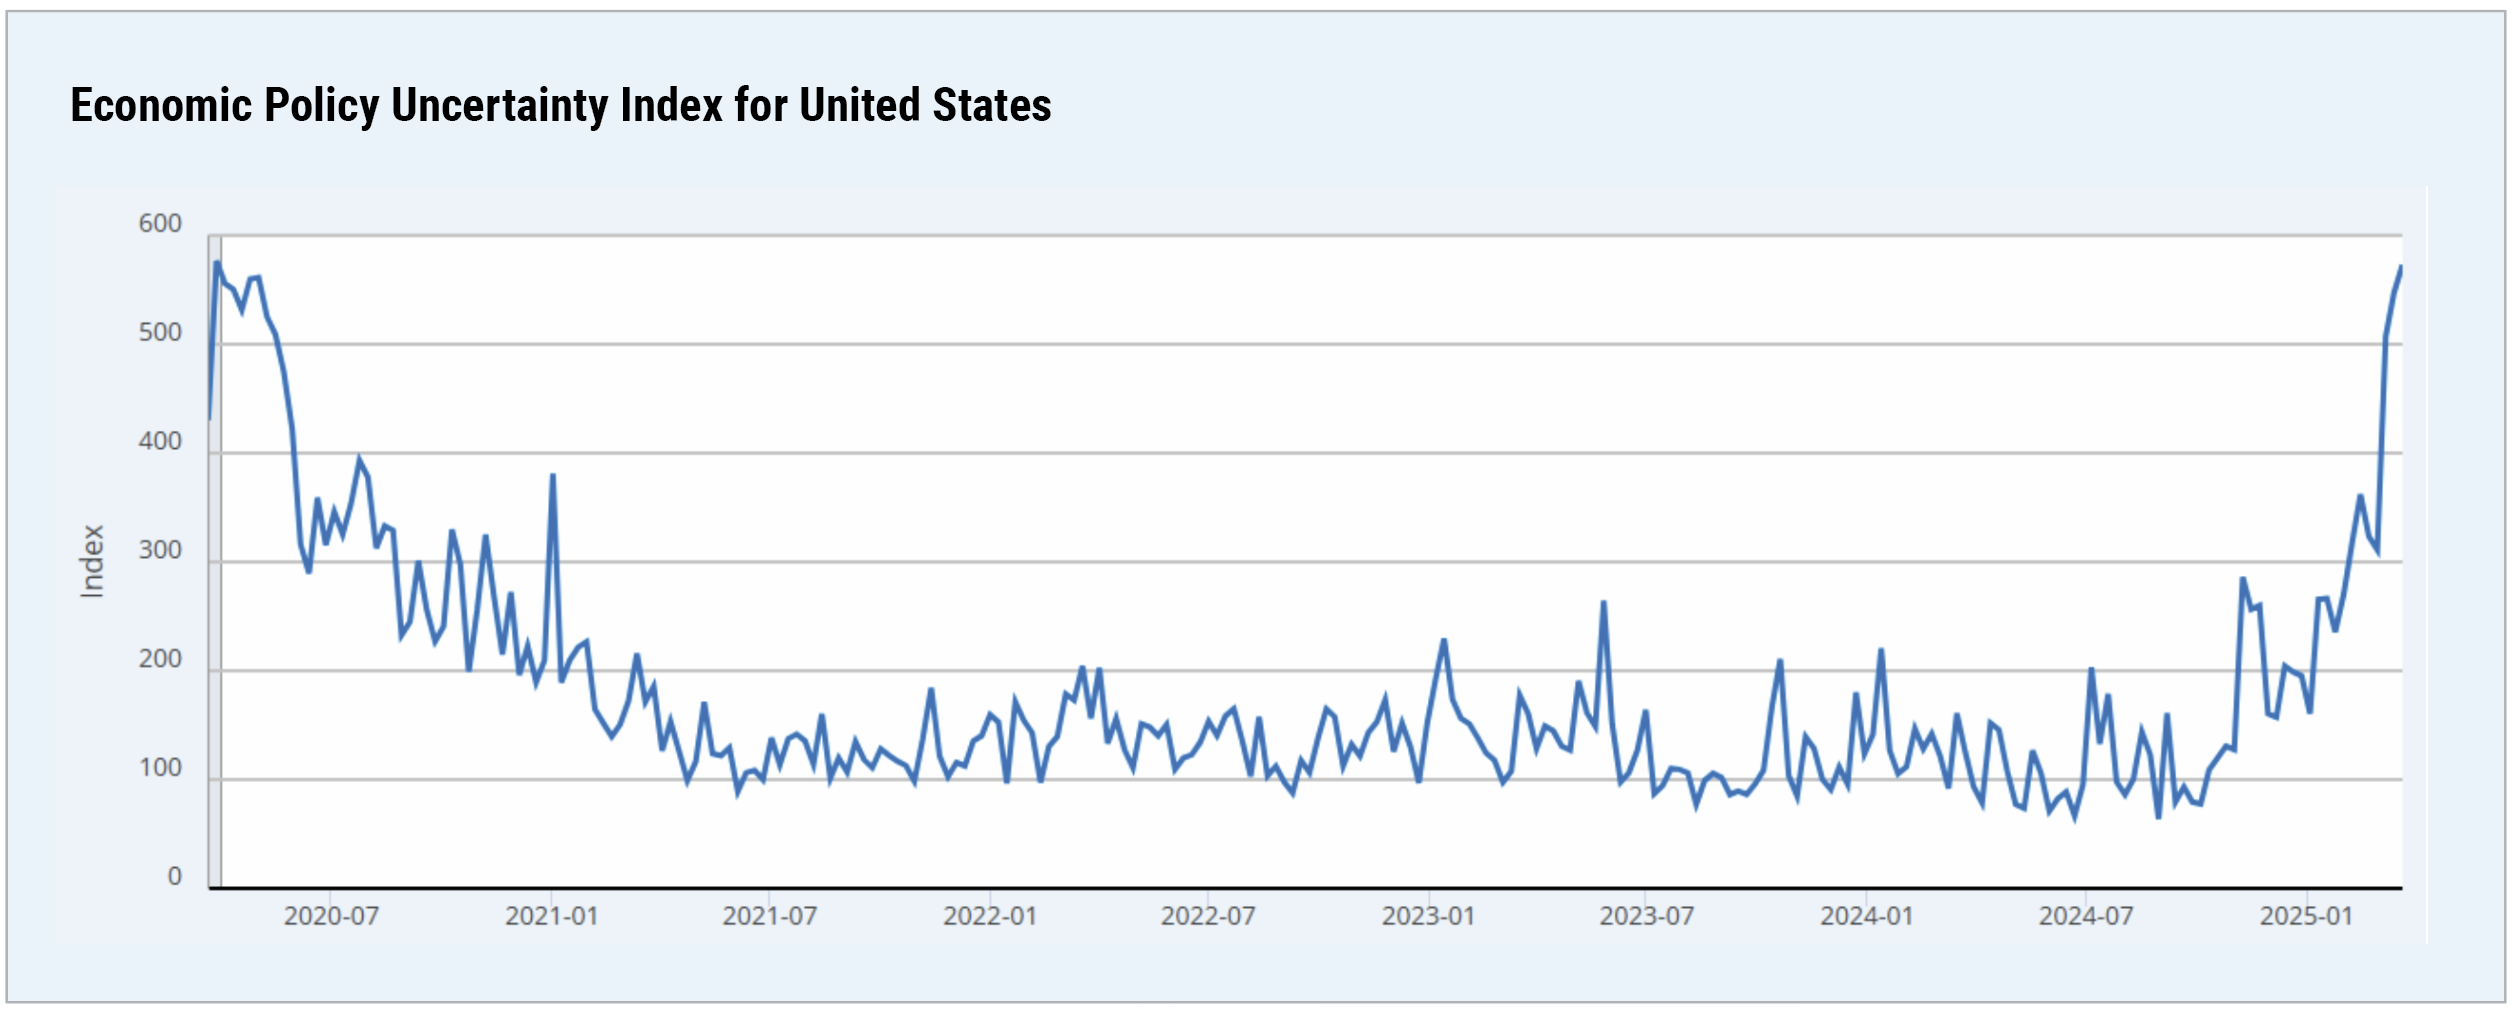
Sources: St. Louis Federal Reserve; Baker, Scott R.; Bloom, Nick; Davis, Stephen J. via FRED® 2020-03-21 to 2025-03-21
Economic public policy uncertainty is hardly a secret. The U.S. Economic Policy Uncertainty Index (EPU) is currently at an extreme, in the top 10% of readings since 1985. An index reading in the top decile has historically been a bullish setup for the next three months. Data from Renaissance Macro shows the S&P 500 Index has been higher 80% of the time, with an average gain of 8.8% ninety days out. Adding further conviction to that setup is the fact that credit spreads remain relatively low. Bear market declines (20% or more from peak to trough) are almost invariably accompanied by drastically widening spreads—clearly a data point to keep an eye on. While a rally from this level has high odds of occurrence, it could be a rally that remains within a longer-term downtrend.
All market performance figures are sourced from Morningstar.
Cary Street Partners is the trade name used by Cary Street Partners LLC, Member FINRA/SIPC; Cary Street Partners Investment Advisory LLC and Cary Street Partners Asset Management LLC, registered investment advisers. Registration does not imply a certain level of skill or training.
Any opinions expressed here are those of the authors, and such statements or opinions do not necessarily represent the opinions of Cary Street Partners. These are statements of judgment as of a certain date and are subject to future change without notice. Future predictions are subject to certain risks and uncertainties, which could cause actual results to differ from those currently anticipated or projected.
These materials are furnished for informational and illustrative purposes only, to provide investors with an update on financial market conditions. The description of certain aspects of the market herein is a condensed summary only. Materials have been compiled from sources believed to be reliable; however, Cary Street Partners does not guarantee the accuracy or completeness of the information presented. Such information is not intended to be complete or to constitute all the information necessary to evaluate adequately the consequences of investing in any securities, financial instruments, or strategies described herein.
Cary Street Partners and its affiliates are broker-dealers and registered investment advisers and do not provide tax or legal advice; no one should act upon any tax or legal information contained herein without consulting a tax professional or an attorney. We undertake no duty or obligation to publicly update or revise the information contained in these materials. In addition, information related to past performance, while helpful as an evaluative tool, is not necessarily indicative of future results, the achievement of which cannot be assured. You should not view the past performance of securities, or information about the market, as indicative of future results.
Nothing contained herein should be considered a solicitation to purchase or sell any specific securities or investment-related services. There is no assurance that any securities discussed herein have been included in an account’s portfolio, will remain in an account’s portfolio at the time you receive this report, or that securities sold have not been repurchased. The securities discussed do not represent an account’s entire portfolio and, in the aggregate, could represent only a small percentage of the portfolio’s holdings. It should not be assumed that any of the securities transactions or holdings discussed were, or will prove to be, profitable, or that the investment recommendations or decisions made in the future will be profitable or will equal the investment performance of the securities discussed herein. A complete list of every holding’s contribution to performance during the period, and the methodology of the contribution to return, is available by contacting Cary Street Partners Marketing.
International and foreign securities are subject to additional risks such as currency fluctuations, political instability, differing financial standards, and the potential for illiquid markets.
Fixed income investments have several other asset-class specific risks. Inflation risk reduces the real value of such investments, as purchasing power declines on nominal dollars that are received as principal and interest. Interest rate risk comes from a rise in interest rates that causes a fixed income security to decline in price in order to make the market price-based yield competitive with the prevailing interest rate climate. Fixed income securities are also at risk of issuer default or the markets’ perception that default risk has increased.
U.S. Economic Policy Uncertainty Index (EPU) measures policy-related economic uncertainty using newspaper articles, tax code expirations, and disagreement among economic forecasters
Comparative Index Descriptions: Historical performance results for investment indices have been provided for general comparison purposes only and generally do not reflect the deduction of transactions or custodial charges, the deduction of an investment management fee, nor the impact of taxes, the incurrence of which would have the effect of decreasing historical performance results. It should not be assumed that your account holdings do or will correspond directly to any comparative indices. An investor cannot invest directly in the indices shown, and accurate mirroring of the indices is not possible.
The Standard & Poor’s (S&P) 500 Index is an index of 500 stocks seen as a leading indicator of U.S. equities and a reflection of the performance of the large cap universe, made up of companies selected by economists. The S&P 500 is a market value weighted index and one of the common benchmarks for the U.S. stock market.
The MSCI EAFE Index is a stock market index that measures the performance of large- and mid-cap companies across 21 developed markets countries around the world. Canada and the USA are not included. EAFE is an acronym that stands for Europe, Australasia, and the Far East.
The MSCI Emerging Markets is a global stock market index that tracks the performance of large and mid-cap companies across 24 emerging markets. It is maintained by MSCI, formerly Morgan Stanley Capital International, and is used as a common benchmark for global emerging market stock funds.
The Russell 1000® Value Index measures the performance of the large-cap value segment of the US equity universe and is constructed to provide a comprehensive carometer for the large-cap value segment. The index is reconstituted annually to ensure that the represented companies continue to reflect value characteristics.
The Bloomberg Barclays US Aggregate Bond Index (US Agg Bond) is a market capitalization weighted index, meaning the securities in the index are weighted according to the market size of each bond type. Most US traded investment grade bonds are represented. Municipal bonds and Treasury Inflation-Protected Securities are excluded, due to tax treatment issues. The index includes Treasury securities, Government agency bonds, mortgage-backed bonds, corporate bonds, and a small number of foreign bonds traded in the US. CSP2025063
