
|
|

- Congress passed the One Big Beautiful Bill Act (OBBBA), and President Trump signed it into law on July 4th.
- Trade negotiations showed mixed progress ahead of the July 9th tariff deadline, with U.S.–EU and U.S.–Canada talks moving forward, while discussions with Japan stalled. Despite easing tensions, tariff rates remain elevated, posing potential risks to corporate profits and growth.
- The U.S. added 147,000 jobs in June, beating expectations, while the unemployment rate declined to 4.1%. May’s job openings rose to 7.8 million, outpacing expectations and signaling continued labor market strength.
1. OBBBA Signed: Markets React Favorably, Debt Questions Persist
The U.S. House of Representatives passed the One Big Beautiful Bill Act (OBBBA), last Thursday, July 3rd. The legislation was then signed into law, by President Trump, on July 4th. The market reaction following the House vote indicates that investors had already priced in the bill’s likely passage. On Thursday, both the S&P 500 and Nasdaq Composite added to their early week gains. They each hit new record highs for the third time this week, rising about 0.8% and 1% respectively in Thursday’s shortened trading.1 Oil prices edged lower, and the dollar remained broadly flat on a trade-weighted basis.1 U.S. Treasury yields dipped slightly throughout the week, likely in anticipation of Friday morning’s labor market data.1
The final legislation, shaped by the Senate’s revisions, is larger and more expensive than the House’s original proposal, raising its estimated cost to $3.3 trillion over the next decade (excluding interest), according to the Congressional Budget Office.2 The bill extends the 2017 personal tax cuts, raises the SALT deduction cap, and introduces new deductions for tips and overtime, while reducing green energy tax credits and increasing funding for border enforcement. These tax cuts for households and businesses are only partially offset by spending cuts, and while analysts expect a modest economic boost in 2026, the bill is projected to worsen the long-term U.S. debt outlook.
2. Tariff Talks Progress Unevenly as Deadline Nears
Trade policy was a key focus for investors last week, as the 90-day pause on new tariffs neared its July 9th expiration. Talks between the United States and the European Union appeared to move forward, and discussions with Canada also advanced after Canada withdrew its proposed digital services tax.3 However, negotiations with Japan made less progress. Japanese officials resisted a deal that would keep the U.S. auto import tariff at 25%.3 While these developments reduce some uncertainty, tariff rates remain well above the 2.5% level seen at the start of the year.3 This elevated tariff environment could still put pressure on corporate profits and household spending, possibly slowing economic growth. Nevertheless, household finances and economic data have held up through mid-2025. As a result, growth is expected to continue, albeit at a slower but positive pace, in the second half of the year.
3. Job Openings Beat Expectations, Labor Market Still Tight
June’s non-farm payrolls rose by 147,000 jobs, beating expectations of 110,000, while the unemployment rate fell from 4.2% to 4.1%.4 Also released last week, May’s job openings rose to 7.8 million, higher than the expected 7.3 million.4 The number of people quitting their jobs held steady at 3.3 million, indicating that many workers still felt confident in their employment prospects.1 Layoffs and discharges were also little changed. These figures point to a labor market that has remained healthy, with openings continuing to outnumber the 7.2 million unemployed workers.
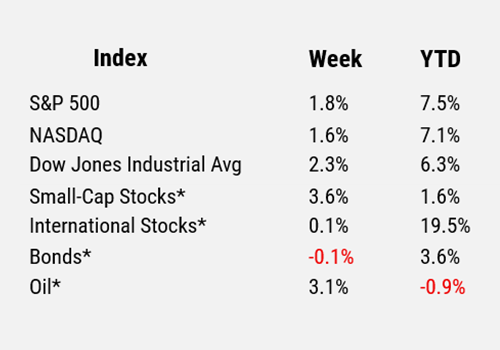
For the period ending 7/3/25.
* Small-cap stocks are represented by the Russell 2000® Index. International stocks are represented by the MSCI EAFE. Bonds are represented by the Bloomberg US Aggregate Bond Index. Oil is represented by WTI Oil (West Texas Intermediate Oil), a benchmark for light, sweet crude oil and a primary measure for pricing oil contracts and futures in the U.S.
Sources
1 FactSet
2 Congressional Budget Office
3 U.S. International Trade Commission
4 U.S. Bureau of Labor Statistics
Disclosures
Any opinions expressed here are those of the authors, and such statements or opinions do not necessarily represent the opinions of Cary Street Partners. These are statements of judgment as of a certain date and are subject to future change without notice. Future predictions are subject to certain risks and uncertainties, which could cause actual results to differ from those currently anticipated or projected.
These materials are furnished for informational and illustrative purposes only, to provide investors with an update on financial market conditions. The description of certain aspects of the market herein is a condensed summary only. Materials have been compiled from sources believed to be reliable; however, Cary Street Partners does not guarantee the accuracy or completeness of the information presented. Such information is not intended to be complete or to constitute all the information necessary to evaluate adequately the consequences of investing in any securities, financial instruments, or strategies described herein.
Cary Street Partners and its affiliates are broker-dealers and registered investment advisers and do not provide tax or legal advice; no one should act upon any tax or legal information contained herein without consulting a tax professional or an attorney.
We undertake no duty or obligation to publicly update or revise the information contained in these materials. In addition, information related to past performance, while helpful as an evaluative tool, is not necessarily indicative of future results, the achievement of which cannot be assured. You should not view the past performance of securities, or information about the market, as indicative of future results.
Additional Disclosures: International and Foreign Securities, Fixed Income Investments, the Consumer Price Index, the Producer Price Index.
Comparative Index Descriptions: The Standard & Poor’s (S&P) 500 Index, The Russell 200® Index, The NASDAQ Composite Index, The MSCI EAFE Index, Dow Jones Industrial Average® (Dow Jones or DJIA), The Bloomberg Barclays US Aggregate Bond Index (US Agg Bond), The CBOE Volatility Index (VIX). CSP2025061_16V2
