
|
|

- The S&P 500 Index ended last week up 24%, breaking its February record and rising over 20% since its April low.1 This comes on the back of strong corporate earnings, easing trade tensions, and resilient economic data.
- The dollar slid to its lowest level in three years, due to market speculation over President Trump weighing potential nominees to replace Fed Chair Powell after his term ends.
- May’s PCE data showed modest price gains, with headline PCE coming in as expected and core PCE coming in slightly hot. Alternatively, CPI came in below forecasts and the Fed held rates steady.
1. Strong Earnings and Steady Economic Data Push U.S. Stocks to New Heights
U.S. equity markets returned to its all-time high last week. On Friday, the S&P 500 set a record high and returned to where it began shortly after the start of President Trump’s second term.3 The index rose more than 24% from its April 8th low, supported by easing trade tensions, steady economic indicators, and strong first-quarter corporate earnings.1
2. Dollar Slides to Three-Year Low Amid Fed Leadership Speculation
Contrary to its equity counterparts, the U.S. dollar hit a three-year low last week and appeared vulnerable to further decline, as President Trump signaled he may announce a nominee to replace Federal Reserve Chair Jerome Powell — well before Powell’s term ends in May 2026.2 The highly unusual move spooked investors because such announcements typically come just a few months ahead of a transition. Trump’s dissatisfaction with Powell’s cautious approach to rate cuts is likely driving the accelerated timeline. An early announcement could raise concerns about the Fed’s independence and weigh on investor confidence, potentially accelerating the dollar’s weakening. The U.S. Dollar Index (DXY) fell to approximately 97 during trading last Thursday.1
3. May’s Inflation Data Shows Modest Increases; Fed Holds Policy Steady
Inflation data came into focus again last week, with Friday’s release of the May reading of the FED’s preferred inflation gauge, the Personal Consumption Expenditures (PCE) Index. Headline PCE rose 0.1% month-over-month and 2.3% year-over-year. Core PCE, which excludes food and energy, also increased 0.2% for the month and 2.7% from the prior year. While headline PCE met consumer expectations of a 0.1% month-over-month and 2.3% year-over-year increase, core PCE came in slightly above expectations at 0.1% for the month and 2.6% annual increase.3
Earlier in the month, the Consumer Price Index (CPI) came in below expectations for May. Core CPI rose 0.1% month-over-month and 1.7% on a three-month annualized basis, the slowest pace since July 2023.3 The report showed little evidence of tariff-related price pressure. Core goods prices remained flat for the month and increased 0.3% year over year.3
Long-term inflation expectations remained stable, and interest rate policy was unchanged as of the latest Federal Reserve meeting.
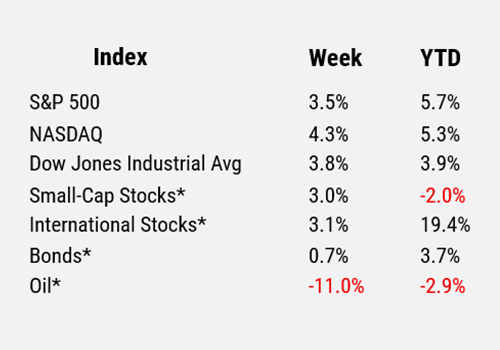
For the period ending 6/27/25.
* Small-cap stocks are represented by the Russell 2000® Index. International stocks are represented by the MSCI EAFE. Bonds are represented by the Bloomberg US Aggregate Bond Index. Oil is represented by WTI Oil (West Texas Intermediate Oil), a benchmark for light, sweet crude oil and a primary measure for pricing oil contracts and futures in the U.S.
Sources
1 YCharts
2 Wall Street Journal
3 FactSet
Disclosures
Cary Street Partners is the trade name used by Cary Street Partners LLC, Member FINRA/SIPC; Cary Street Partners Investment Advisory LLC and Cary Street Partners Asset Management LLC, registered investment advisers. Registration does not imply a certain level of skill or training.
Any opinions expressed here are those of the authors, and such statements or opinions do not necessarily represent the opinions of Cary Street Partners. These are statements of judgment as of a certain date and are subject to future change without notice. Future predictions are subject to certain risks and uncertainties, which could cause actual results to differ from those currently anticipated or projected.
These materials are furnished for informational and illustrative purposes only, to provide investors with an update on financial market conditions. The description of certain aspects of the market herein is a condensed summary only. Materials have been compiled from sources believed to be reliable; however, Cary Street Partners does not guarantee the accuracy or completeness of the information presented. Such information is not intended to be complete or to constitute all the information necessary to evaluate adequately the consequences of investing in any securities, financial instruments, or strategies described herein.
Cary Street Partners and its affiliates are broker-dealers and registered investment advisers and do not provide tax or legal advice; no one should act upon any tax or legal information contained herein without consulting a tax professional or an attorney.
We undertake no duty or obligation to publicly update or revise the information contained in these materials. In addition, information related to past performance, while helpful as an evaluative tool, is not necessarily indicative of future results, the achievement of which cannot be assured. You should not view the past performance of securities, or information about the market, as indicative of future results.
Additional Disclosures: International and Foreign Securities, Fixed Income Investments, the Consumer Price Index, the Producer Price Index.
Comparative Index Descriptions: The Standard & Poor’s (S&P) 500 Index, The Russell 2000® Index, The NASDAQ Composite Index, The MSCI EAFE Index, Dow Jones Industrial Average® (Dow Jones or DJIA), The Bloomberg Barclays US Aggregate Bond Index (US Agg Bond), The CBOE Volatility Index (VIX). CSP2025061_15
