
|
|

- The U.S. and China agreed to reduce tariffs on most goods, which should improve trade flows and boost business and consumer confidence.
- The Producer Price Index (PPI) fell in April and retail sales growth slowed. Despite tariffs, inflation remains manageable, but slower growth is expected.
- Economists and investors are monitoring the divergence between soft and hard data for indications about the direction of the economy.
1. U.S. and China Cut Tariffs
The U.S. has agreed to reduce tariffs on most Chinese goods to 30%, down from 145%, for 90 days.1 In return, China will cut its tariffs on most U.S. products to 10%, down from 125%.1 The U.S. rate includes a 10% general tariff for all countries and an extra 20% aimed at pressuring the Chinese government to curb the flow of fentanyl into the U.S. Other tariffs, like the 25% tax on steel and aluminum, will stay in place. Both countries agreed to continue trade talks. These new rates are lower than markets expected, and should ease tensions, helping trade flow more smoothly and improving confidence among businesses, consumers and investors.
2. April Data Shows Slower Growth and Easing Inflation
Last week, the Producer Price Index (PPI), which tracks prices received by U.S. producers, came in lower than expected. PPI fell 0.5% in April, compared to forecasts for a 0.2% increase, and rose 2.4% over the past year.1 Markets cheered the news, taking it as a potential sign that tariffs may end up having less impact on prices than initially feared.
On the consumer side, retail sales slowed in April. Headline sales rose just 0.1%, missing the 0.2% estimate and well below March’s 1.7% increase.1 Core retail sales, which exclude volatile food & energy, fell 0.2%, versus an expected 0.4% gain.1 Weaker spending on discretionary items, such as sporting goods and other non-essential products, drove much of the slowdown.
Looking ahead to the second half of 2025, tariffs may pressure prices and weigh on consumer demand. Trade deals announced in the coming weeks should provide more clarity for the market, but for now, it’s still too early to tell which tariffs will remain in place and what the broader repercussions for growth will be. Until then, investors can only speculate about the impact on businesses. Still, we don’t see tariffs as a long-term threat to inflation or a reason for the Fed to hike rates. With a strong job market and healthy household finances, we anticipate that the economy will keep growing next year, albeit more slowly than in recent years.
3. Hard and Soft Data Diverge amid Trade Policy Shifts
Soft and hard economic data are sending mixed signals as trade policy continues to shift. Soft data, such as surveys, measures sentiment, expectations, intentions, and how respondents feel about the economy. Recently, several soft data indicators, including consumer and CEO confidence, have sharply deteriorated. High mortgage rates and prices have caused a decline in homebuilder sentiment. Business survey results also signal weakness, although the Philadelphia Fed’s outlook improved slightly following the latest 90-day tariff pause.
Meanwhile hard data – which measures actual results and activity, such as production levels, spending, and sales – remains strong. Job growth, spending, bank lending, as well as manufacturing and construction, have all moved higher. While there are soft spots, such as higher jobless claims and slower housing starts, most indicators point to a growing economy. This gap between soft and hard data is important as sentiment can be a leading indicator of an economic shift. Given fast-changing conditions, it’s important to track both to understand where the economy might be headed.
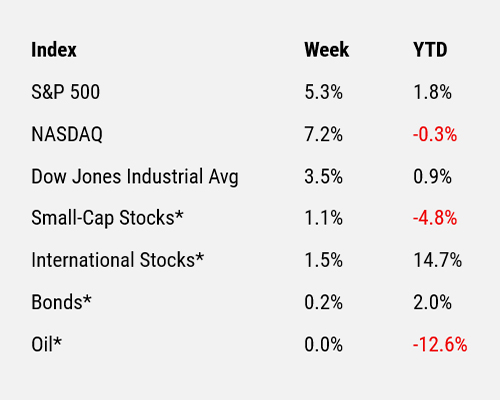
For the period ending 5/16/25.
* Small-cap stocks are represented by the Russell 2000® Index. International stocks are represented by the MSCI EAFE. Bonds are represented by the Bloomberg US Aggregate Bond Index. Oil is represented by WTI Oil (West Texas Intermediate Oil), a benchmark for light, sweet crude oil and a primary measure for pricing oil contracts and futures in the U.S.
Sources
1 FactSet
Disclosures
Cary Street Partners is the trade name used by Cary Street Partners LLC, Member FINRA/SIPC; Cary Street Partners Investment Advisory LLC and Cary Street Partners Asset Management LLC, registered investment advisers. Registration does not imply a certain level of skill or training.
Any opinions expressed here are those of the authors, and such statements or opinions do not necessarily represent the opinions of Cary Street Partners. These are statements of judgment as of a certain date and are subject to future change without notice. Future predictions are subject to certain risks and uncertainties, which could cause actual results to differ from those currently anticipated or projected.
These materials are furnished for informational and illustrative purposes only, to provide investors with an update on financial market conditions. The description of certain aspects of the market herein is a condensed summary only. Materials have been compiled from sources believed to be reliable; however, Cary Street Partners does not guarantee the accuracy or completeness of the information presented. Such information is not intended to be complete or to constitute all the information necessary to evaluate adequately the consequences of investing in any securities, financial instruments, or strategies described herein.
Cary Street Partners and its affiliates are broker-dealers and registered investment advisers and do not provide tax or legal advice; no one should act upon any tax or legal information contained herein without consulting a tax professional or an attorney.
We undertake no duty or obligation to publicly update or revise the information contained in these materials. In addition, information related to past performance, while helpful as an evaluative tool, is not necessarily indicative of future results, the achievement of which cannot be assured. You should not view the past performance of securities, or information about the market, as indicative of future results.
Additional Disclosures: International and Foreign Securities, Fixed Income Investments, the Consumer Price Index, the Producer Price Index.
Comparative Index Descriptions: The Standard & Poor’s (S&P) 500 Index, The Russell 2000® Index, The NASDAQ Composite Index, The MSCI EAFE Index, Dow Jones Industrial Average® (Dow Jones or DJIA), The Bloomberg Barclays US Aggregate Bond Index (US Agg Bond), The CBOE Volatility Index (VIX). CSP2025061_9
