Review and Outlook
From their mid-June low through the 18th of August, equities picked up short-term momentum and advanced about 16%1 using the S&P 500 as a proxy, a classic bear market rally. A 6% pullback has since ensued up to this writing. While we are constructive on equities long-term, beyond 12 months in outlook, we remain cautious short-term. When we entered bear market territory for the S&P 500 Index (a decline of 20% from peak), our longterm assumptions for equity returns went higher as featured in previous commentary. In other words, a lot is priced in at this point. Keep in mind markets are not the economy, and they are seen as a future discounting mechanism. In June, bearish sentiment indicators that are contrarian in nature were at extremes not seen since the COVID lows of 2020. That was the market’s best attribute at the time, and that attribute is no longer in place. Sentiment, while not extremely bullish, noticeably moderated as the market advanced. This degree of complacency, combined with short-term overbought conditions, created a dynamic for the recent pullback. The triggering event of course was the Federal Reserve’s Jackson Hole symposium, led by Chairman Jay Powell’s hawkish speech, but reinforced by uniform commitment to tightening liquidity coming from every Fed quarter. Bottom line: our summary conclusion is that while we are long-term positive, we are short-term cautious as the equity market is likely to test support levels found around 4000, and more significantly 3815 for the SPX. Equities are still fighting the Fed with a series of Fed funds rate hikes, a balance sheet runoff, and low money-supply growth, all in the front window. A good setup that we would like to see is the pullback accompanied by a spiking CBOE Volatility Index (VIX). A spiking VIX, particularly if it reaches a level in the mid-thirties, would indicate a healthy dose of fear. This would be a good indication of another market bottom as the sentiment attribute returns.
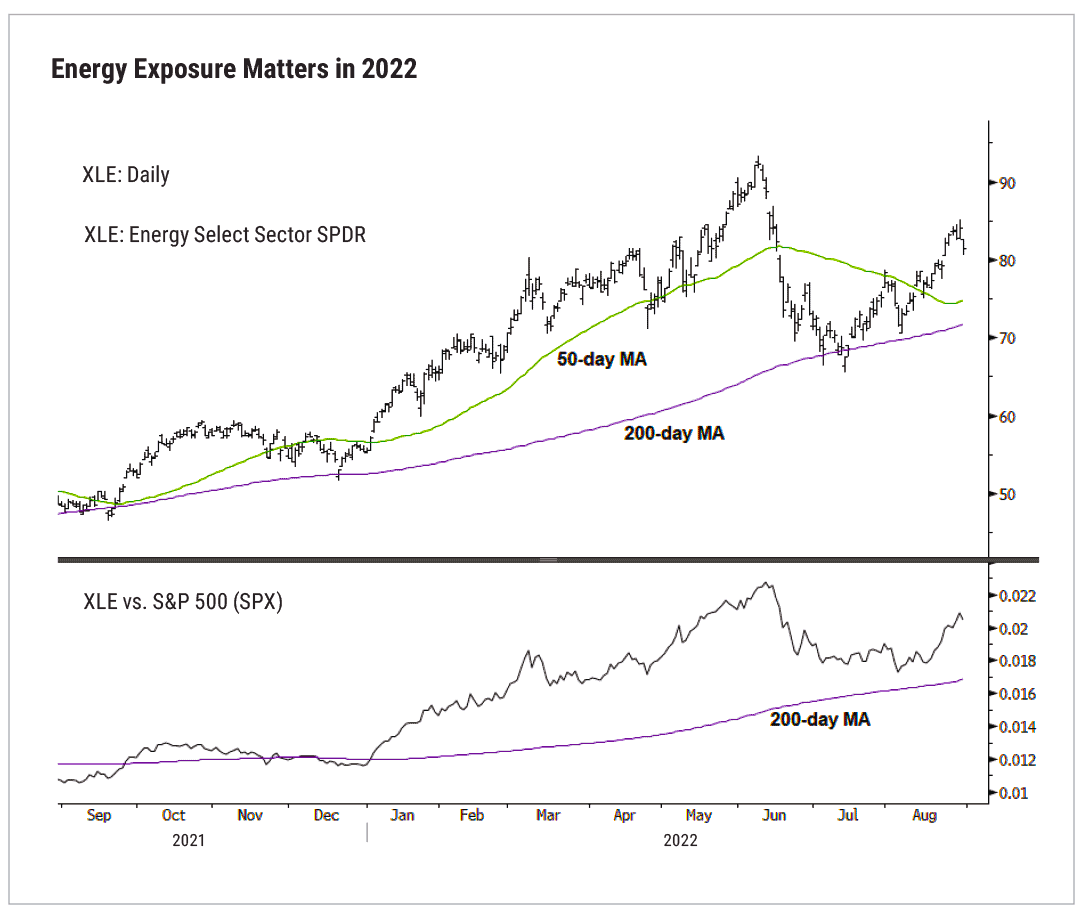
From a positioning perspective, the energy sector continues to be this year’s winner, and that uptrend is still very much intact. Along with utilities, these are the only two sectors to generate positive returns in 2022. Technology and consumer discretionary, while doing better so far this quarter, are not in uptrends and are vulnerable during pullbacks. The market is in late cycle, which is favorable to energy, utilities, and health care.
Energy remains a consistent outperformer relative to the broad market. Energy is up about 54.5% YTD, versus the S&P which is down about 16.5%2.

Data as of 8.30.22. Source: Fairlead Strategies
Economics
Inflation is the order of the day. Our base case for inflation has been a peak as indicated by numerous market signals followed by a deceleration. July CPI and PCE data showed some evidence of the peak as month-over-month increases were lower than expected. As liquidity continues to tighten, we expect further deceleration. That’s the good news. The bad news is that what remains in terms of tightening is likely to take some time. The FOMC (Federal Open Market Committee) will need to see numerous months of month-overmonth decelerating inflation before they get to the 2% target. If monthly data indicates greater deceleration the Fed may ease up on the size or pace or Fed funds rate hikes. However this group is keenly aware that they made a mistake staying loose on monetary policy for a year too long. Commentary from the Fed is and should be intent on not repeating the mistake of the 1970’s, which prior to the Volcker regime, featured a Fed that stopped and started. That Fed never got inflation rates down to low single digits, and consequently created growing inflation expectations, which resulted in a series of higher highs. This Fed is uniformly hawkish; there are zero doves.
The Fed playbook is classic: tighter monetary policy = tighter financial conditions = lower demand = lower inflation. The fallout economically is weaker or negative growth. In fact, we have already experienced two consecutive quarters of negative GDP. A sustained yield curve inversion, one in which short-term rates are higher than long-term, is a demonstrated forecaster of recession. The curve has been inverted this year briefly in March and on a sustained basis since June. As mentioned above, the markets are not the economy. Being forward-looking, equities often begin to perform better at the outset of recession.
¹ Bloomberg
² MarketWatch
Past performance is no guarantee of future results.
This material has been prepared or is distributed solely for informational purposes and is not a solicitation or an offer to buy any security or instrument or to participate in any trading strategy. Any opinions expressed or implied herein are those of the speakers and do not necessarily reflect the opinions of their respective firms and are subject to change without notice. Any mention of specific investments, asset classes, or market sectors are intended for general discussion and should not be misconstrued as investment advice. Investors must make decisions based on their specific investment objectives and financial circumstances. Past performance is no guarantee of future results. Additional information is available upon request. Global/International investing involves risks not typically associated with U.S. investing, including currency fluctuations, political instability, uncertain economic conditions, and different accounting standards.
Cary Street Partners is the trade name used by Cary Street Partners LLC, Member FINRA/SIPC; Cary Street Partners Investment Advisory LLC and Cary Street Partners Asset Management LLC, registered investment advisers.
CSP2022112 ©2022 CARY STREET PARTNERS LLC, All Rights Reserved.