Review and Outlook
Equities posted sizable gains during the month of October as negative, COVID-surge-induced, sentiment swung from an overly risk-off condition to risk-on by month end. Indeed, as forecast in our Q3 Commentary, COVID cases have moderated significantly as the reproduction rate has dropped. The S&P 500 Index gained 5.74%¹ in October. Underlying participation also improved as the small- and mid-capitalizations were also up. Within the market, growth outperformed for the month; the growth proxy Russell 1000 Growth Index was up 7.86%¹ versus the Russell 1000 Value Index, which was up 3.52%.¹ Over the last year we have seen cyclical out-performance, although there have been periods of growth out-performance, such as October. Driving the 12-month cyclical out-performance has been the 10-Year Treasury Yield, which remains in an uptrend after breaking out above 1.53%. A higher 10 is a strong indication of higher growth and inflation for Q4, a favorable climate for cyclical market sectors such as energy and financials as opposed long-term growth sectors such as technology. This dynamic is also beginning to show up in Q3 earnings reports. The same climate that favors cyclicals favors small caps. Investors should ensure exposure to cyclicals and small caps.

Source: FactSet, St. Louis Fed 11/30/1979 to 8/31/2021
The current equity backdrop is favorable, although the elevated fear we saw
entering October has dissipated. The best data point regarding fear is the CBOE Volatility Index (VIX), a price that began October well above 200 day and YTD moving averages, trading near upside resistance at 25. It ended the month in the exact opposite condition, repeatedly testing support at 15. In other words, it went from one extreme of its recent trading range to the other. Our favored entry points for market exposure all year have been when the dynamic of higher fear, a spiking VIX, is present alongside the year-long presence of tight credit spreads. Credit stress is an early and effective indicator of larger equity drawdowns, drawdowns beyond healthy corrective activity. While the canary-in-the-coal-mine condition of credit spreads remain all clear, widespread fear is not present. This is not necessarily a forecast of a short-term market decline, but rather a less favorable entry point from a risk/reward standpoint.
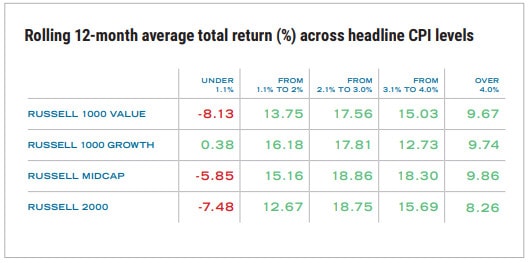
The higher 10-year yield has also resulted in a continuation of the 2021 bear market in bonds. This is a condition we previously forecast going into 2021, and we see no end in sight for this challenging asset class. Bond prices move opposite yield. The 10-year, which serves as a proxy for longer-term rates, began the year at .92%, closing October at 1.55%. The U.S. Aggregate Index for bonds is down 1.58%¹ for 2021, and the Global Aggregate Index is down 4.29%.¹ The 40-year bond bull market ended in Q1 of 2021. This has major implications for portfolio positioning as investors have benefited from a simple 60/40 equity/bond exposure for decades. That dynamic has changed, and investors need to incorporate a higher structural inflation environment into their thinking. What works best in this climate are cyclical and smaller-cap stocks, hard asset plays within equities such as energy and real estate, and beneficiaries of higher rates such as financials. For investors needing a smoother sequence of returns than long-only exposure to equities, predictable hedging strategies are a solution. Certain rate-hedged bond strategies can also thread the needle to achieve some positive results in that market. These are the places to look for additional diversification beyond the common 60/40 blend. As an aside, as seen in the accompanying chart, inflation is not the worst backdrop for stock returns; deflation is.
Economics
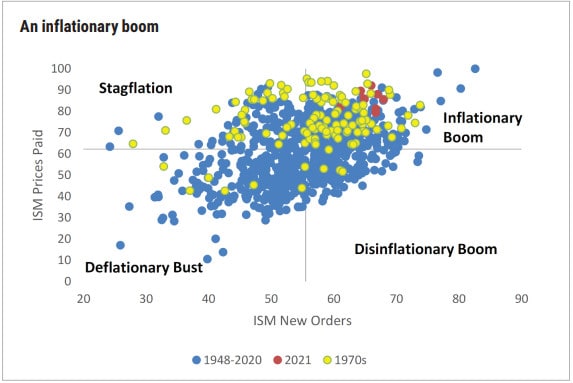
The current economic setup is all about growth and inflation, both heavily influenced by COVID. This is a setup for higher Q4 GDP growth as COVID cases wane, the opposite of Q3, which saw a poor initial GDP print of 2%, due almost entirely to the summer COVID delta variant surge. There is a lot of chatter in the media about stagflation, a condition of stalling growth and high inflation. This is astounding as no data supports that opinion. If we had stagflation, you would see data such as new orders below average and inflation above average. The actual data is new orders above average along with inflation above average. The current situation is better characterized as an inflationary boom. Stagflation can happen, but it is not present now.

Source: Renaissance Macro Research, Haver Analytics
As we have published for well over a year now, we are in a higher structural-inflation dynamic. Core CPI and PCE inflation data is running around 4%, with headline numbers higher. Well publicized supply chain factors are a partial culprit here, with COVID disrupting the symphony of global supply chains. Markets effectively will sort this out over time. More troublesome in our opinion are sticky price increases coming from rents and labor-shortage-induced wage increases. While the Federal Reserve has tolerated inflation above its average 2% target for some time, they likely act to begin tapering the monthly bond purchase program in November, or latest December. Fed action will prevent the sort of runaway inflation of four decades ago, but the Fed may be late to this party and need to be more forceful later, as opposed to being early and less forceful. Short-term rate hikes are still some time away, but the beginning of Fed tightening typically acts to temper the trajectory of forward-equity returns. In summary, expect inflation to remain in the 2%–5% range for the next few quarters at least.
1 Marketwatch
Past performance is no guarantee of future results.
Cary Street Partners is the trade name used by Cary Street Partners LLC, Member FINRA/SIPC; Cary Street Partners Investment Advisory LLC and Cary Street Partners Asset Management LLC, registered investment advisers.
This information was prepared by or obtained from sources believed to be reliable, but Cary Street Partners does not guarantee its accuracy or completeness. Any opinions expressed or implied herein are subject to change without notice. The material has been prepared or is distributed solely for information purposes and is not a solicitation or an offer to buy any security or instrument or to participate in any trading strategy. An investor cannot invest directly in an index.
CSP2021214 © COPYRIGHT 2021 CARY STREET PARTNERS LLC, ALL RIGHTS RESERVED.