
By Thomas O. Herrick
Market Strategist
Markets have been quiet up until the last two weeks, maybe too quiet. As public policy uncertainty, particularly around tariffs, has spiked recently, equities have begun to wobble. The S&P 500 Index at this writing sits at 5861, hitting its all-time closing high of 6144 on February 19th. Supporting equities have been Q4 earnings that have come in well above expectations. With almost all names reporting at this point, earnings growth for the S&P looks to be over 17%. That is the strongest growth since the last quarter of 2021 and several percent above earlier estimates. Estimates for 2025’s earnings growth also look stout, with the S&P up 12 to 13%. Notably, earnings growth is finally improving overseas as well, and developed markets especially have seen increased expectations for 2025. Rising earnings expectations are the strongest fundamental input supporting stocks.
The greatest challenge to stock prices is policy uncertainty around tariffs. Should the US impose widespread tariffs on significant trading partners, markets will have to contend with a quick revision down in earnings expectations. The drag on S&P earnings looks to be about 1 to 2% for every 5% tariff increase. Additionally, tariffs have stagflationary implications (lower growth and higher inflation) that potentially impact markets in other ways, such as yields. A cut in the corporate tax rate would offset tariffs from an earnings perspective. Any such tax cut would likely come later in the year as part of a complicated budget process.
Economic policy uncertainty has soared
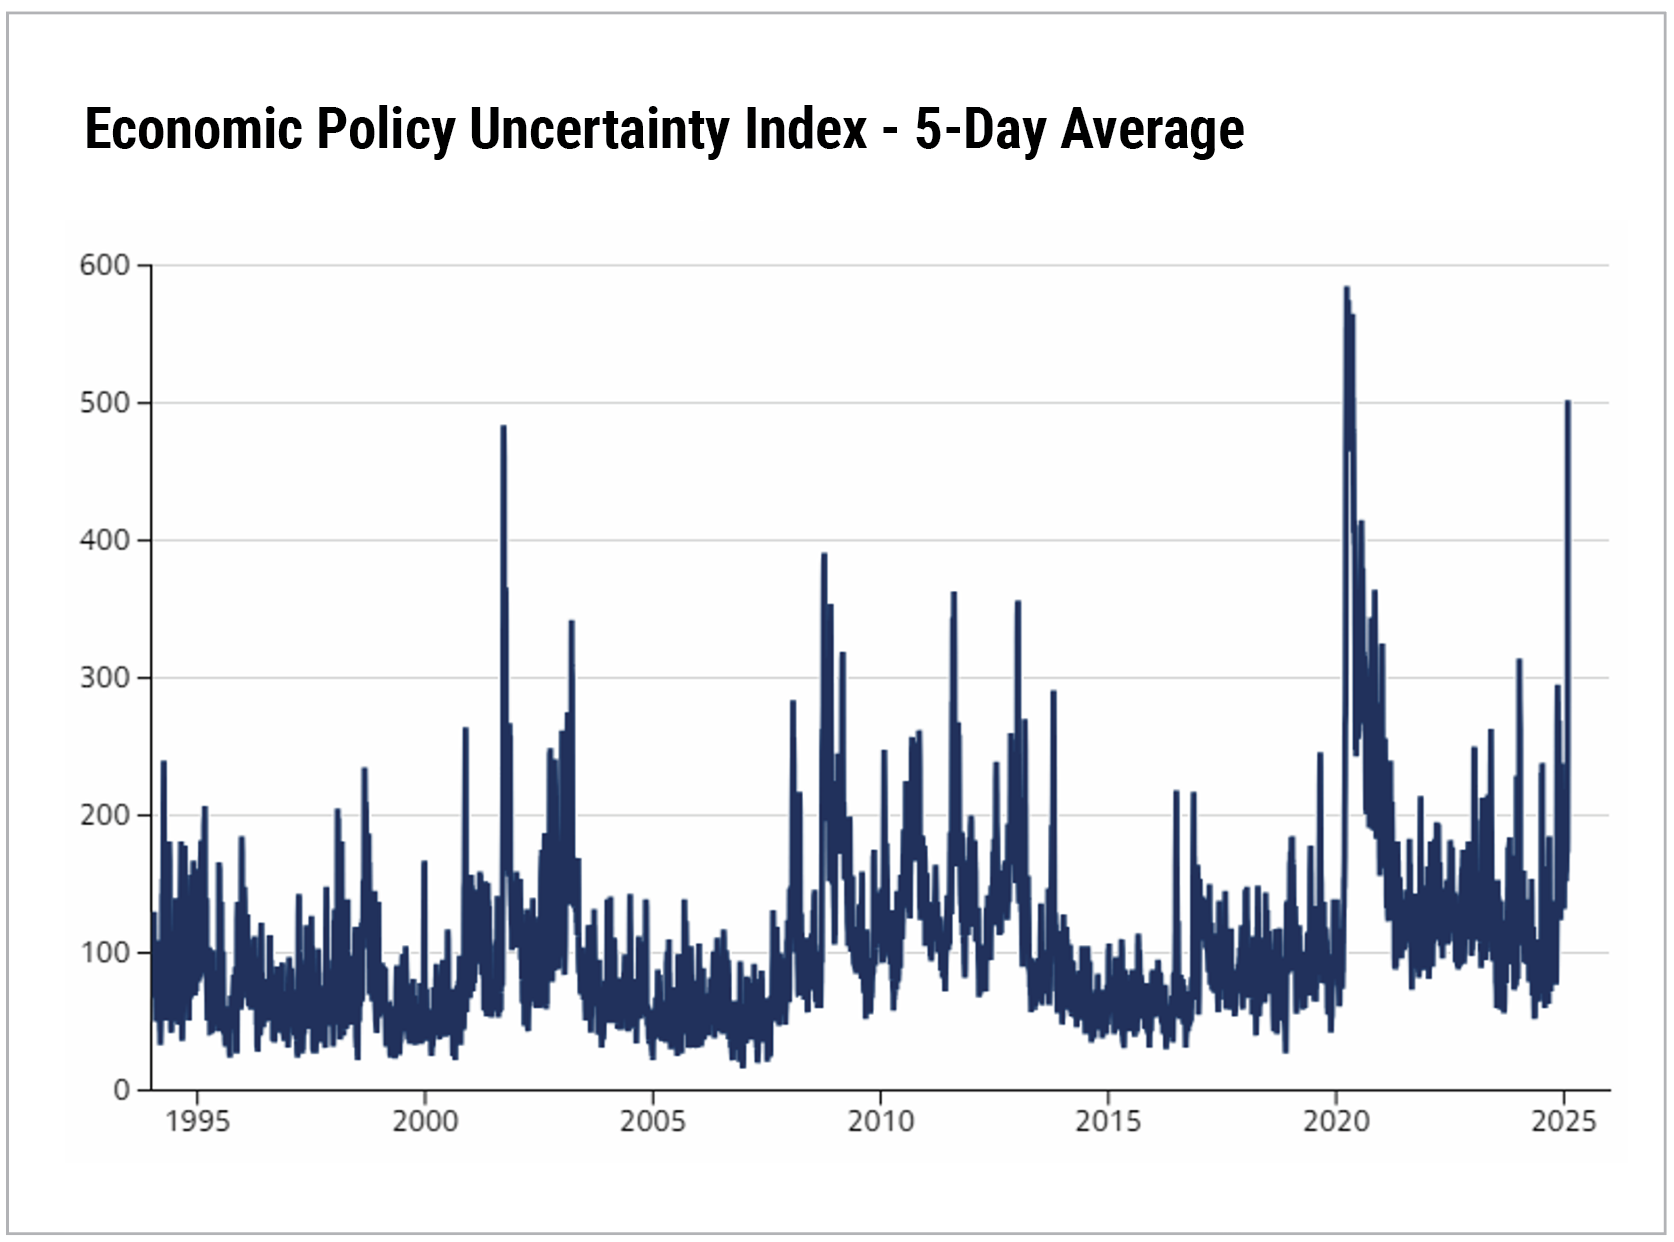
Source: PolicyUncertainty.com, Goldman Sachs Research
Within equity markets, earnings growth and performance are broadening beyond the Magnificent Seven. The group is down about 8% YTD versus the S&P 500, which is essentially flat. Equal weight S&P is up about 1.7%. Additionally, equal weight S&P on a sector basis (as opposed to companies) is up even more, about 3%. While earnings growth in the Magnificent Seven remains above the broader market, it has slowed, whereas earnings growth among the remaining 493 S&P constituents has picked up. This shift highlights broadening market performance, favoring an equal-weight approach.
All market performance figures are sourced from Bloomberg.
Cary Street Partners is the trade name used by Cary Street Partners LLC, Member FINRA/SIPC; Cary Street Partners Investment Advisory LLC and Cary Street Partners Asset Management LLC, registered investment advisers. Registration does not imply a certain level of skill or training.
Any opinions expressed here are those of the authors, and such statements or opinions do not necessarily represent the opinions of Cary Street Partners. These are statements of judgment as of a certain date and are subject to future change without notice. Future predictions are subject to certain risks and uncertainties, which could cause actual results to differ from those currently anticipated or projected.
These materials are furnished for informational and illustrative purposes only, to provide investors with an update on financial market conditions. The description of certain aspects of the market herein is a condensed summary only. Materials have been compiled from sources believed to be reliable; however, Cary Street Partners does not guarantee the accuracy or completeness of the information presented. Such information is not intended to be complete or to constitute all the information necessary to evaluate adequately the consequences of investing in any securities, financial instruments, or strategies described herein.
Cary Street Partners and its affiliates are broker-dealers and registered investment advisers and do not provide tax or legal advice; no one should act upon any tax or legal information contained herein without consulting a tax professional or an attorney. We undertake no duty or obligation to publicly update or revise the information contained in these materials. In addition, information related to past performance, while helpful as an evaluative tool, is not necessarily indicative of future results, the achievement of which cannot be assured. You should not view the past performance of securities, or information about the market, as indicative of future results.
Nothing contained herein should be considered a solicitation to purchase or sell any specific securities or investment-related services. There is no assurance that any securities discussed herein have been included in an account’s portfolio, will remain in an account’s portfolio at the time you receive this report, or that securities sold have not been repurchased. The securities discussed do not represent an account’s entire portfolio and, in the aggregate, could represent only a small percentage of the portfolio’s holdings. It should not be assumed that any of the securities transactions or holdings discussed were, or will prove to be, profitable, or that the investment recommendations or decisions made in the future will be profitable or will equal the investment performance of the securities discussed herein. A complete list of every holding’s contribution to performance during the period, and the methodology of the contribution to return, is available by contacting Cary Street Partners Marketing.
Comparative Index Descriptions: Historical performance results for investment indices have been provided for general comparison purposes only and generally do not reflect the deduction of transactions or custodial charges, the deduction of an investment management fee, nor the impact of taxes, the incurrence of which would have the effect of decreasing historical performance results. It should not be assumed that your account holdings do or will correspond directly to any comparative indices. An investor cannot invest directly in the indices shown, and accurate mirroring of the indices is not possible.
The Standard & Poor’s (S&P) 500 Index is an index of 500 stocks seen as a leading indicator of U.S. equities and a reflection of the performance of the large cap universe, made up of companies selected by economists. The S&P 500 is a market value weighted index and one of the common benchmarks for the U.S. stock market. CSP2025036
