The Gravitational Pull of Higher Yields
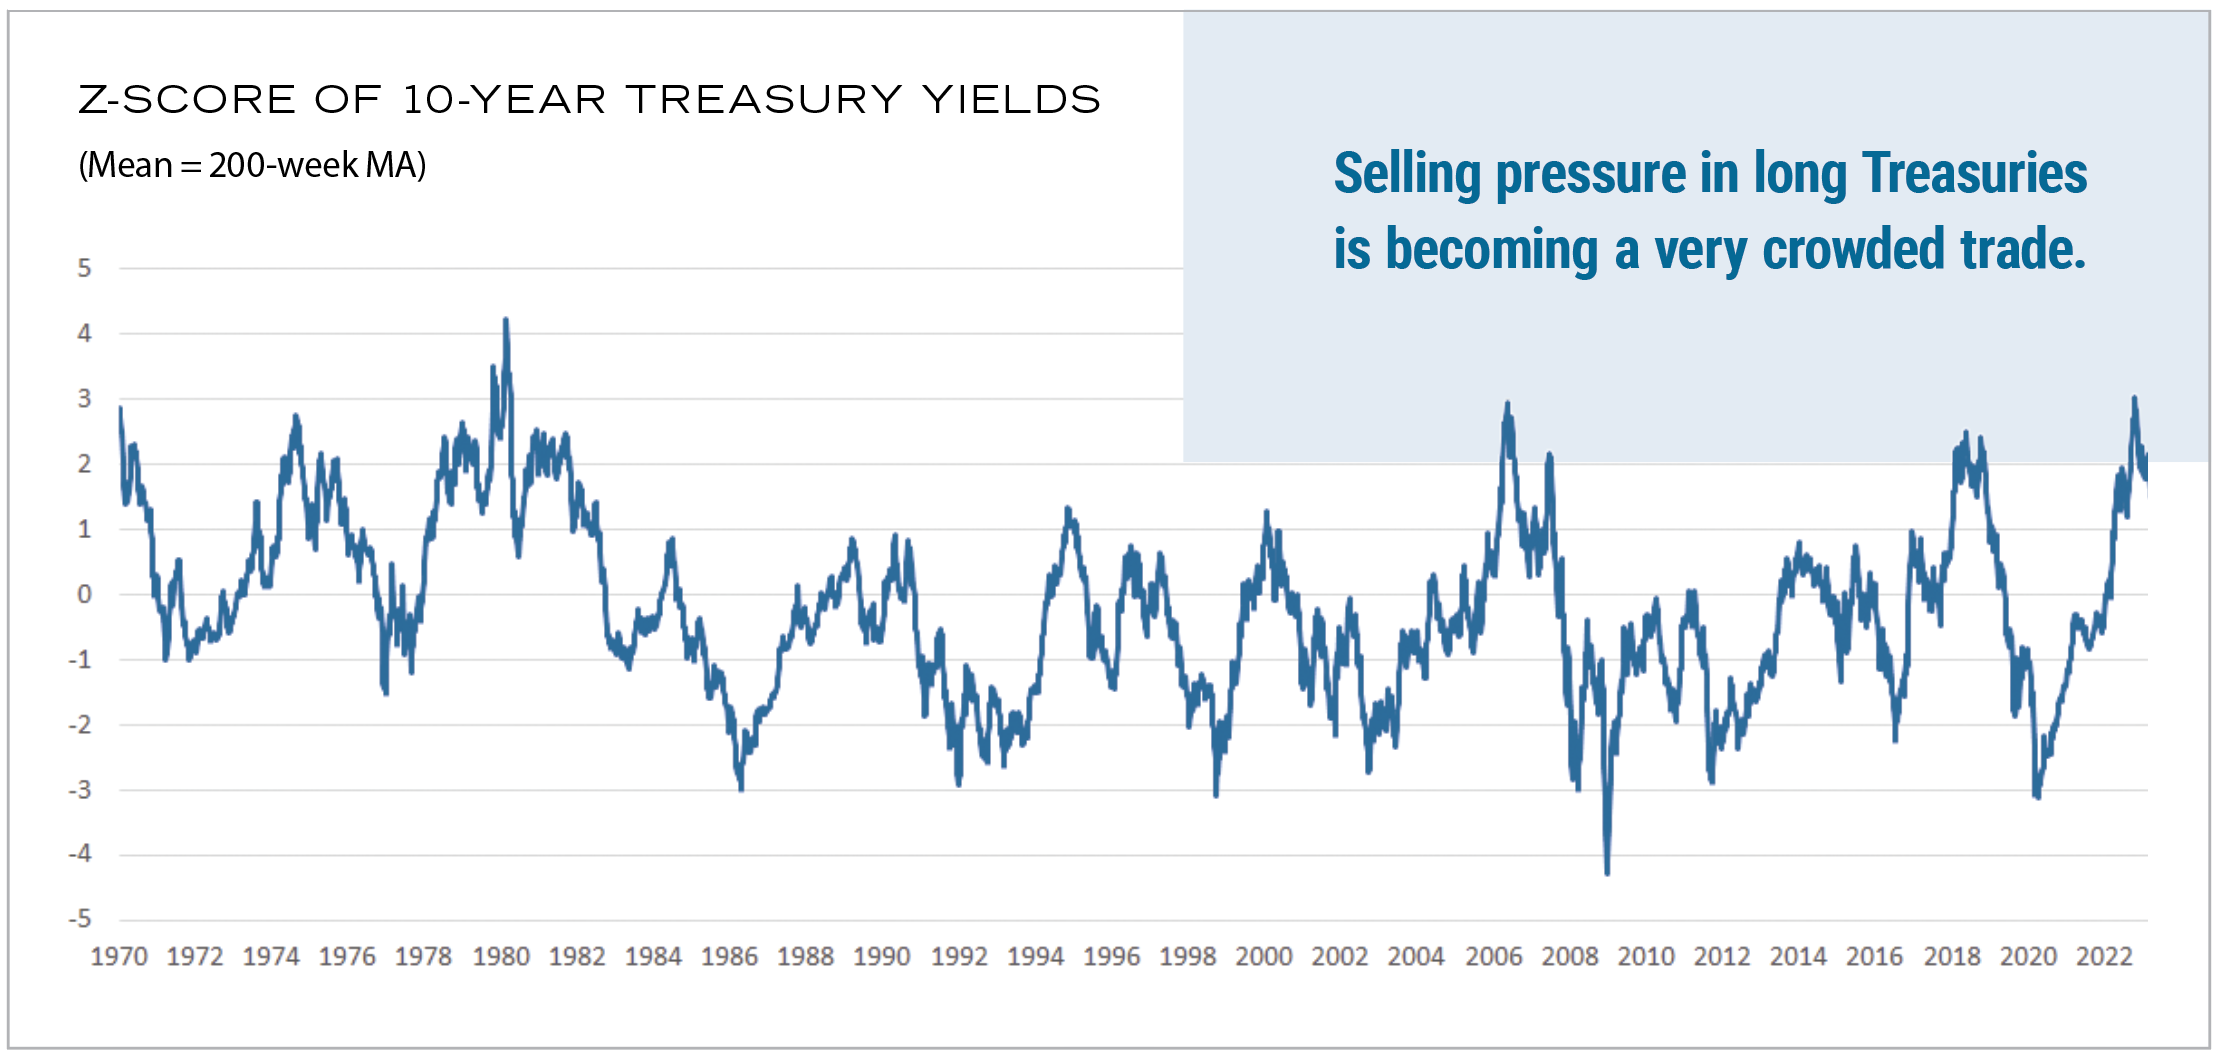
Risk assets do not do well when yields move higher. The third quarter was a case in point. Regardless of our viewpoint that yields have overshot, the price is the price, and there is no denying the impediment that yields present to stocks and bonds. Higher yields pressure equity prices as they create a higher discount rate and higher cost of capital. They pressure bond prices as they must mathematically re-price to the downside. This remains a rate-driven backdrop for markets with equities and bonds highly correlated. The surge in yields over the third quarter can be attributed to “higher for longer” Fed rhetoric regarding future Fed funds rate policy—more on that below, first the butcher’s bill for Q3. Through today, the S&P 500 Index is down 2.58%, and mid and small caps are worse, with the Russell Mid Cap Index down 4.62% and the Russell 2000 is down 5.65%. Bonds, as measured by the Bloomberg US Aggregate, are down 2.29%. Market forecasting is an exercise in measuring odds; yields at the highest levels since 2007 markedly increase the odds that risk assets struggle. The move in the 10-year Treasury yield has been almost two standard deviations so far, not yet at the extreme of three standard deviations but still elevated. Selling pressure in long Treasuries is becoming a crowded trade.
While challenges are evident in the short term for risk assets, longer-term investors are being presented with good opportunities in both stocks and bonds, particularly small-cap stocks. Lower risk hedging strategies are performing very well this year as higher rates and volatility play to their strength. Well-run hedging strategies such as CSP Global continue to capture a high level of equity market upside while limiting drawdown.

Source: Fairlead Strategies
In our opinion, “higher for longer” ends up in the same dustbin as “transitory”. Fed rhetoric will remain hawkish right up until the point the data refutes that viewpoint. “Higher for longer” fear is based on very suspect Fed forecasts—some recent cases point out how dubious that forecasting is. At the end of 2021, the Federal Reserve forecast a Fed funds rate of 1% at the end of 2022. The actual result at the end of 2022: Fed funds were 4.25%. Their forecast for 2022 core inflation at that time was 2.5% to 3%. The actual result was double that figure. The reality is that the Fed is reactive and will change its rhetoric and, further down the road, begin to ease rates based on actual inflation results, particularly core CPI and PCE prints.1
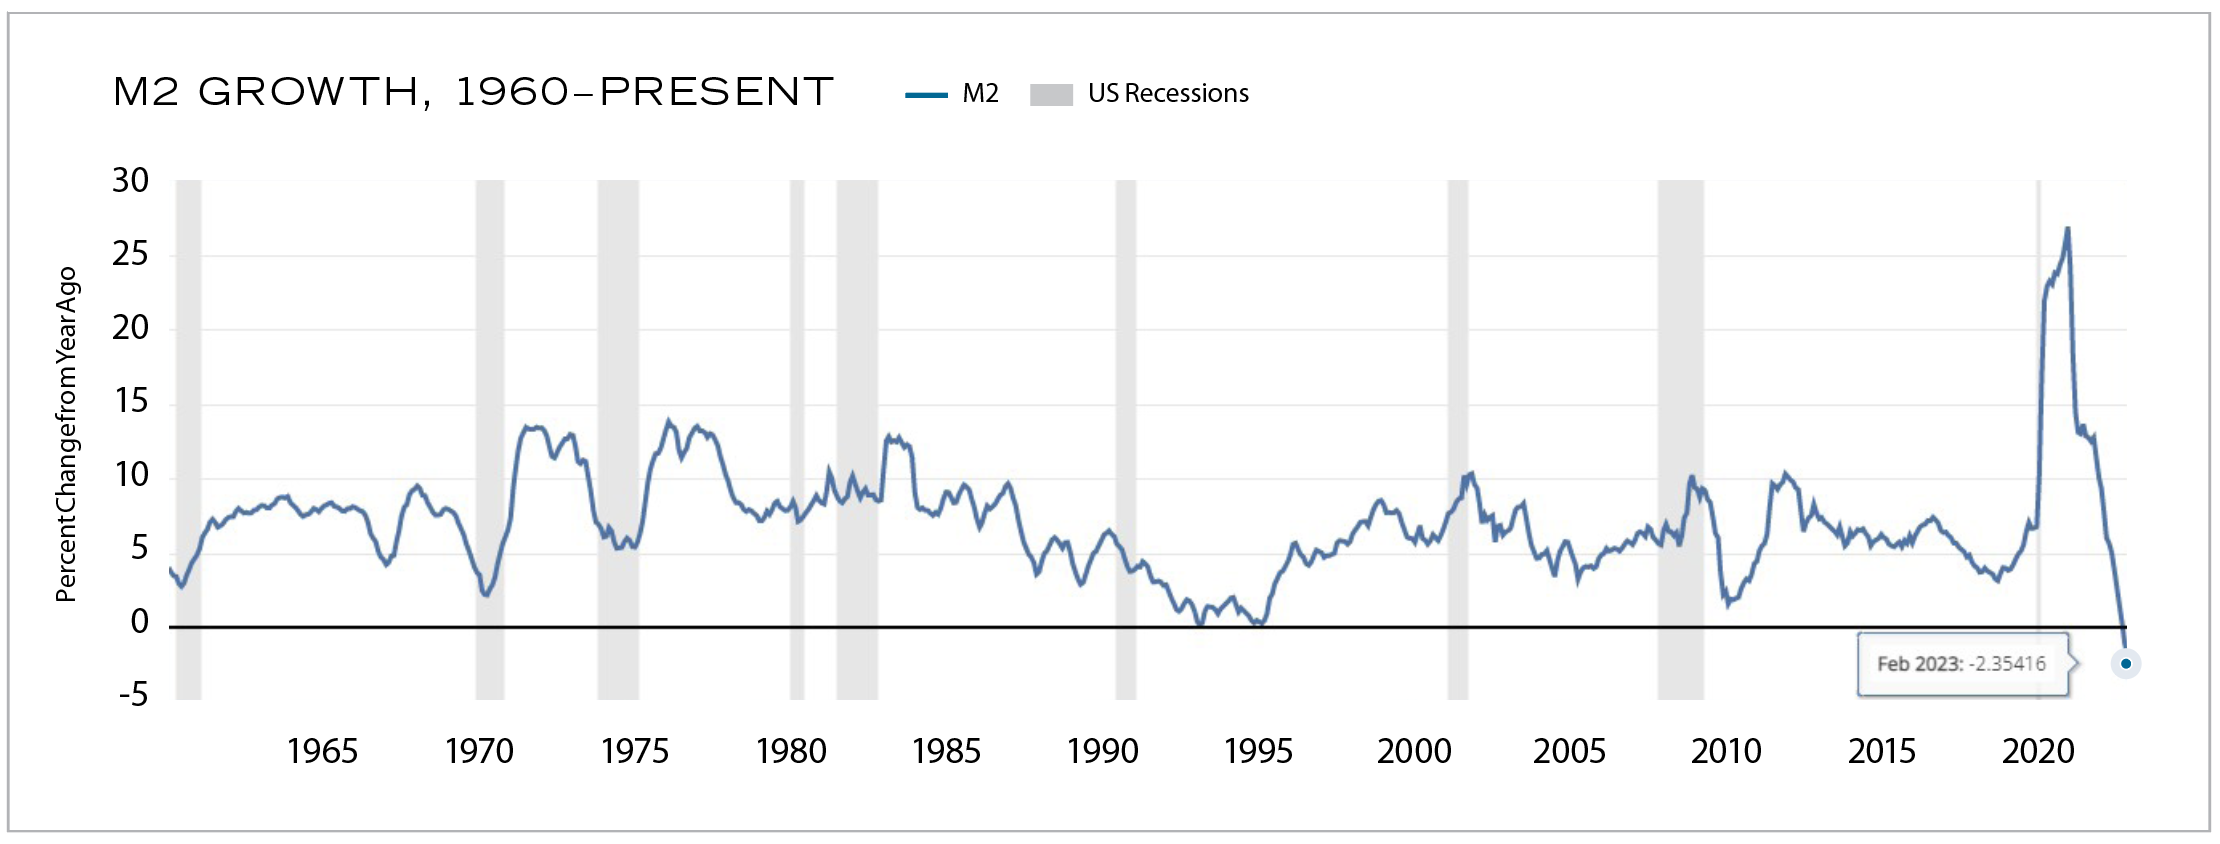
Our base case for inflation remains one of a continued dis-inflation trend. Outside of gasoline and diesel in the headline data, there are virtually no inflation pressures to the upside. Energy is not in the core data, so it is not likely to influence the Fed, but these commodities also have a history of price fixing price as demand destruction sets in. Inflation is powered in both directions by monetary factors. Massive M2 growth let the inflation genie out of the bottle in 2021 and early 2022 with about a 12-month lead time. The same dynamic has been in place on the downside as headline inflation peaked in July last year and core in October. M2 growth, which was modest after the first quarter in 2022 and has been negative since late 2022, is acting with the same 12-month lag on inflation data to create a dis-inflation trend.

Source: Board of Governors of the Federal Reserve System (US)
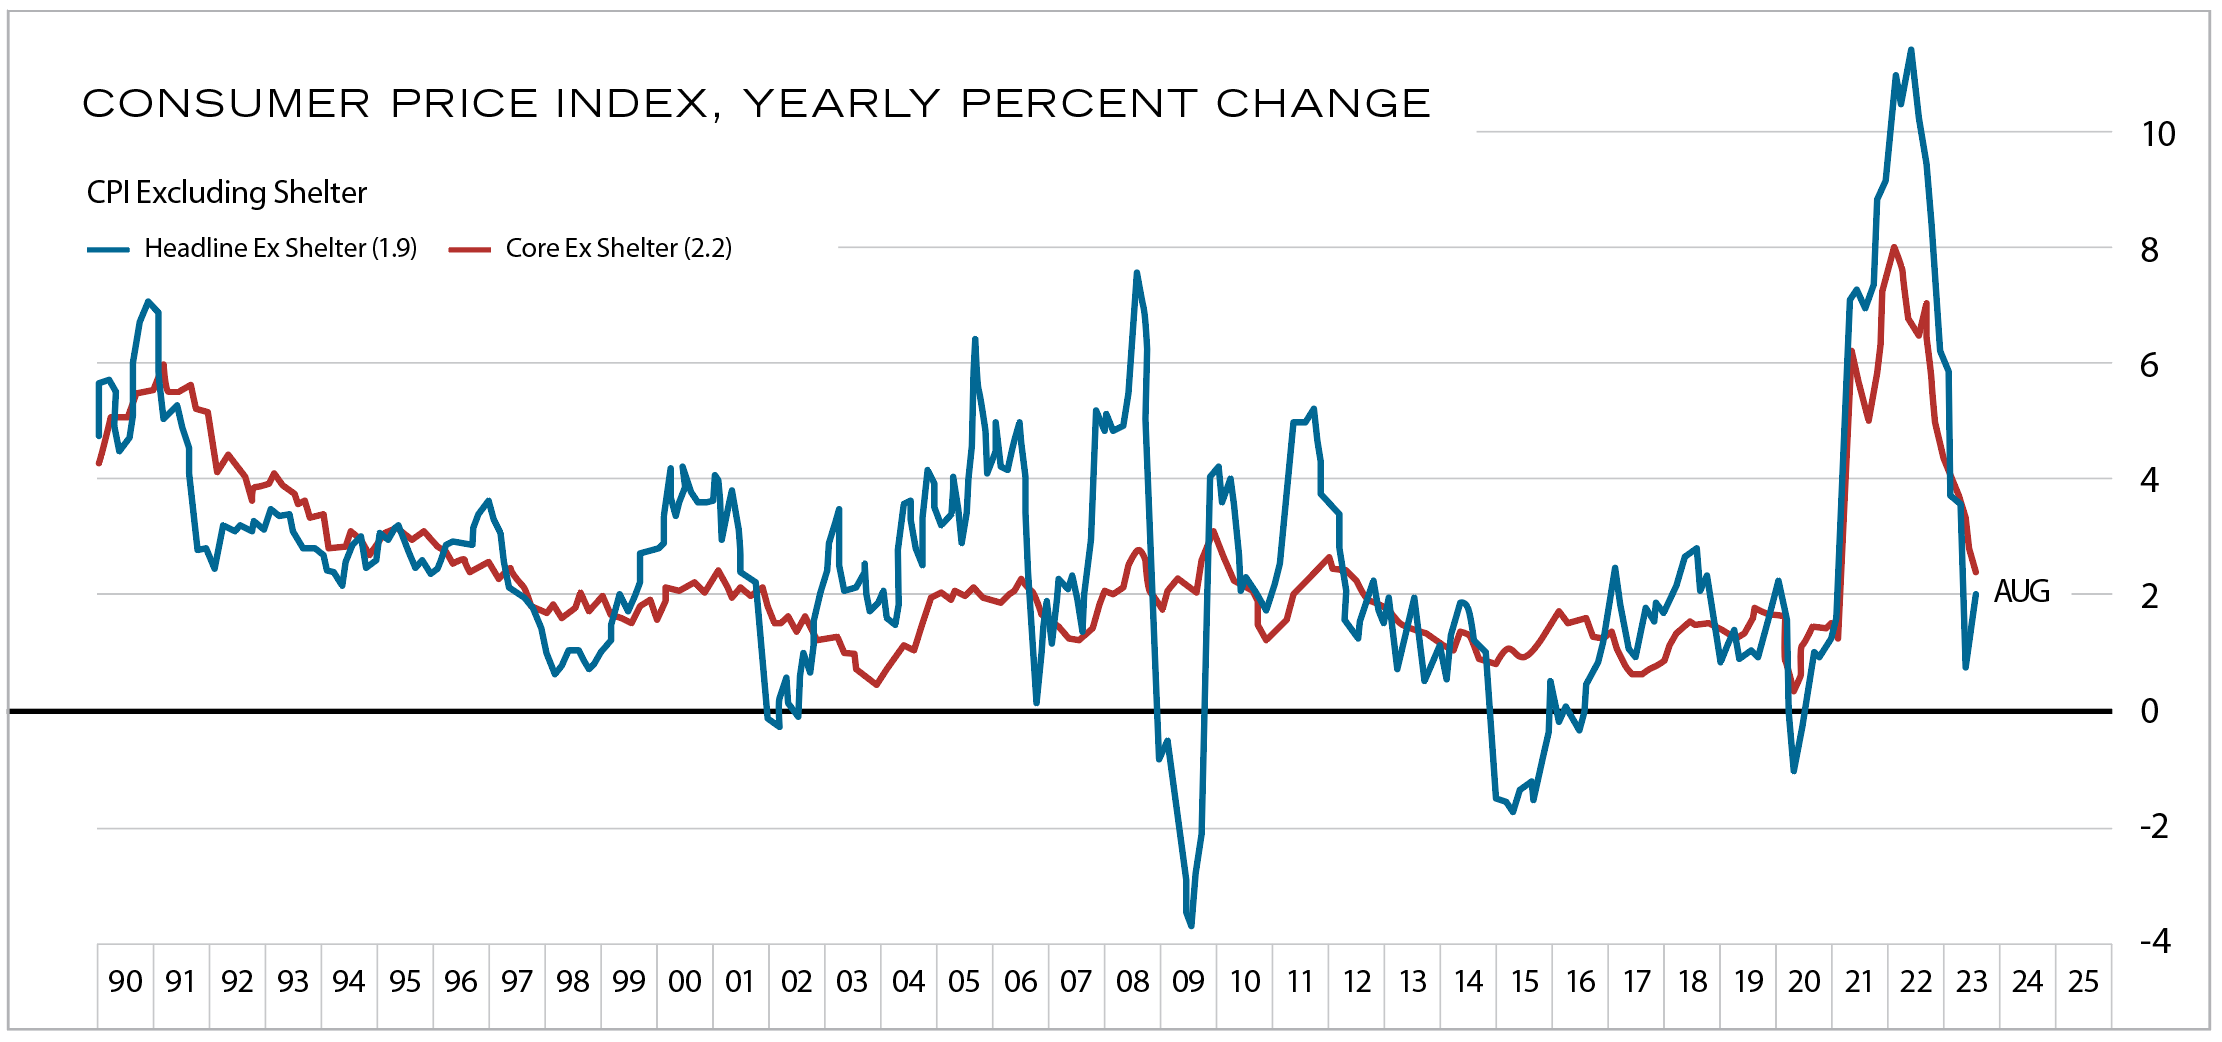
A very large, forward-looking data point is the shelter component within CPI. Shelter has accounted for almost the entire increase in CPI over the last several monthly reports. The Bureau of Labor Statistics (BLS) methodology in the CPI around shelter is antiquated and operates with huge lags. Vacancy rates for apartments are climbing, new lease incentives are returning, and all is happening just as a record number of new apartments are headed for completion. If the BLS used real-time data such as the Apartment List Index instead of their lagging methodology, headline CPI would be 1.2% right now.

Sources: BLS, Haver Analytics, Yardeni.com
The size and speed of the upward move in yields, combined with a base case of lower inflation prints, sets up a good backdrop for longer-term investors. Risk assets will respond quickly to inflation prints and an end to “higher for longer chatter.” All said, CPI data is the crucial nexus to validate dis-inflation. A recession is a 50/50 probability as a fallout of the enormous move in Fed funds from zero to a current 5.25%. The 50% probability of keeping economic growth on track without a recession is buoyed by the enormous gains in productivity we have witnessed post-pandemic.
A recession would have implications for positioning within equities but not necessarily be an overall market impediment. Equity trends turn on inflation turns, such as last October. These often coincide with early recession conditions, but not always. Bonds should respond very positively to any potential recession as all the rhetoric changes to talk of rate cuts.
1 The Consumer Price Index (“CPI”) and Personal Consumption Expenditures (“PCE”) index are measures of inflation. Generally speaking, the PCE includes a more comprehensive coverage of goods and services than the CPI.
Cary Street Partners is the trade name used by Cary Street Partners LLC, Member FINRA/SIPC; Cary Street Partners Investment Advisory LLC and Cary Street Partners Asset Management LLC, registered investment advisers. Registration does not imply a certain level of skill or training.
Any opinions expressed here are those of the authors, and such statements or opinions do not necessarily represent the opinions of Cary Street Partners. These are statements of judgment as of a certain date and are subject to future change without notice. Future predictions are subject to certain risks and uncertainties, which could cause actual results to differ from those currently anticipated or projected.
These materials are furnished for informational and illustrative purposes only, to provide investors with an update on financial market conditions. The description of certain aspects of the market herein is a condensed summary only. Materials have been compiled from sources believed to be reliable; however, Cary Street Partners does not guarantee the accuracy or completeness of the information presented. Such information is not intended to be complete or to constitute all the information necessary to evaluate adequately the consequences of investing in any securities, financial instruments, or strategies described herein.
Cary Street Partners and its affiliates are broker-dealers and registered investment advisers and do not provide tax or legal advice; no one should act upon any tax or legal information contained herein without consulting a tax professional or an attorney.
We undertake no duty or obligation to publicly update or revise the information contained in these materials. In addition, information related to past performance, while helpful as an evaluative tool, is not necessarily indicative of future results, the achievement of which cannot be assured. You should not view the past performance of securities, or information about the market, as indicative of future results.
Nothing contained herein should be considered a solicitation to purchase or sell any specific securities or investment related services. There is no assurance that any securities discussed herein have been included in an account’s portfolio, will remain in an account’s portfolio at the time you receive this report, or that securities sold have not been repurchased. The securities discussed do not represent an account’s entire portfolio and, in the aggregate, could represent only a small percentage of the portfolio’s holdings. It should not be assumed that any of the securities transactions or holdings discussed were, or will prove to be, profitable, or that the investment recommendations or decisions made in the future will be profitable or will equal the investment performance of the securities discussed herein. A complete list of every holding’s contribution to performance during the period, and the methodology of the contribution to return, is available by contacting Cary Street Partners Marketing.
CSP2023156
