2021 3Q Equity Review and Forward Outlook
Stocks remained in an uptrend throughout the third quarter. The S&P 500 Index returned 0.58% for the period, led primarily by the technology and communications sectors. For the full year through September the S&P is up 15.92%. On a global basis the MSCI ACWI is up 11.12% in 2021. As we saw in Q2, leadership during Q3 was on the growth side of the market, the Russell 1000 Growth Index up 1.16%. This contrasts to the cyclical, value side, with the Russell 1000 Value down 0.78%. Smaller company stocks were the underperformer for Q3, with the Russell 2000 Index dropping 4.36%. This internal dynamic changed somewhat at the tail end of Q3. As the 10 -year Treasury yield broke heavy resistance at 1.4% moving firmly above 1.5%, a near term rotational chain reaction of cyclical and small cap out performance occurred in the last two weeks of September. A steeper yield curve supports cyclicals and small caps at the expense of longer duration stocks, namely technology. A steeper curve is indicative of accelerating growth and inflation, positively impacting short-duration sectors such as energy and financials to a greater degree than technology, despite technology having greater long- term prospects.
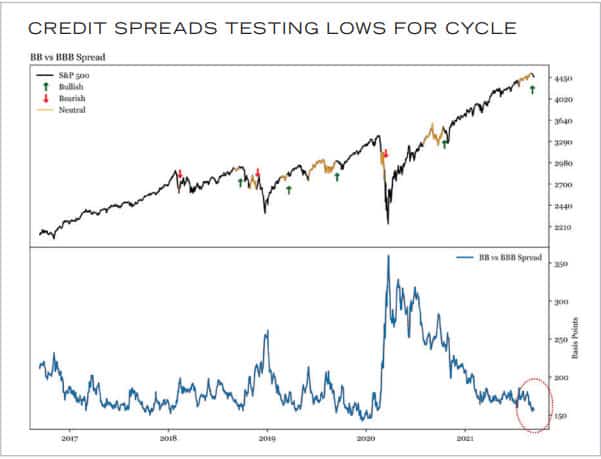
2021 has been a year of persistent uptrend, with a buy-the-dip mentality strongly in place. While there have been plenty of pullbacks, they have been remarkably shallow and quick to mature. We finally got a 5% top-to-bottom pullback in the S&P 500 during September. The month of September was the worst for the market since March 2020, the S&P dropping 4.65%. That index finished the month 5.2% below its all-time high reached earlier in the month. Most of the pullbacks this year have been characterized by quickly spiking fear, which dissipates just as quickly. These periodic drops have been primarily in 3–4% range and only lasted for brief periods of time. A primary factor that looms large in our work is credit. Credit stress is an early and effective indicator of larger price drawdowns in the stock market. This canary in the coal mine remains supportive of stocks. Credit spreads remain tight.

Source: Renaissance Macro
As mentioned above, the 10-year Treasury yield rebounded significantly near quarter-end. Bond prices move opposite bond yield, consequently the higher yield reflects a general sell-off in bonds. The steeper curve, one in which longer-term yields are higher than short-term yields, continues a difficult 2021 environment in which to make money in bonds. The trigger for rates rebounding was a string of strong economic data, along with the higher inflation regime put in place by the Fed a year ago. The fact that the 10-year yield is still not back to pre-pandemic trend, despite higher GDP growth and inflation, suggests further upside pressure to long-duration yields. Following a move through resistance at 1.53%, the next target would be the yearly high of 1.77%.
Equity and Bond Positioning
Within the context of a diversified portfolio, a rotation away from Q2 and Q3 winners toward Q1 winners suggests leaning toward cyclicals and small caps. We recommend exposure to both sides of the market, growth and value, but the cyclical tilt reflected in value historically has more legs left in it than the upside seen earlier in the year. A rotation would also be healthy in that it mitigates a market that further stretches recent winners. Small caps fit this narrative to an even greater extent, as they were the clear laggards through the summer. Equity hedging strategies continue to offer a means of equity market participation with lower volatility. This is an excellent, predictable solution for investors looking for steadier sequence of returns than long-only equity. Higher volatility premiums, reflected in elevated CBOE Volatility Index (VIX) prices, provide a compelling backdrop to execute these strategies. As mentioned above, fixed income is a difficult place to make money, as we forecast in our 2021 Market Outlook back in December. Strategies that are positioned to take advantage of the strong credit environment, coupled with hedging out rate risk, are one of the few ways to thread the needle on bonds.
Economic Outlook
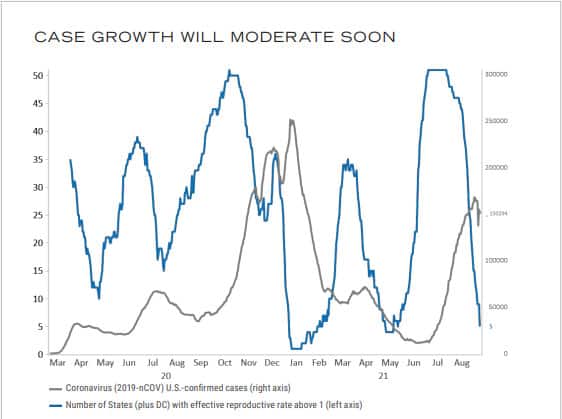
Everything economic continues to pivot on the COVID pandemic. U.S. economic data slowed during Q3 as the delta variant surged through the country. This dynamic essentially deferred some growth until later this year and early in 2022. We look for U.S. data to accelerate in the next two quarters as the COVID surge peaks. The forward-looking data point for COVID cases in the reproduction rate. A reproduction rate below 1 indicates one infected person is infecting less than one additional person. A reproduction rate above 1 indicates the opposite. Reproduction rates below 1 forecast falling caseloads. The number of states with reproduction rates above 1 has plummeted since July, forecasting a peak in the recent surge. This sets the economy up for the opposite experience of Q3, stronger growth.

Source: Renaissance Macro Research, Macrobond
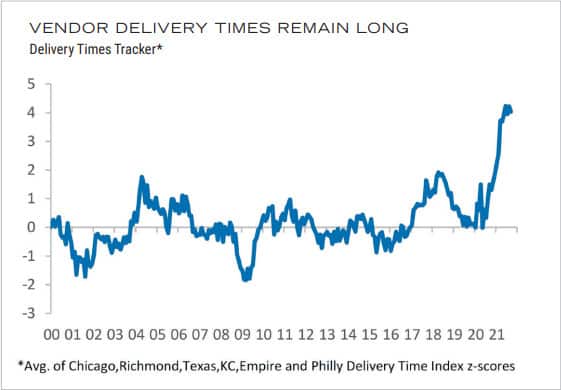
Inflation remains elevated as contrast with the last decade. While many of the underlying factors are transitory and related to economic re-opening, there are some sticker components, namely, rent, that suggest inflation data will stay in the 3–4% range for some time to come. Rent is accelerating, and in addition to being sticky, comprises a large portion of CPI inflation data. Supply chain issues also continue to plague the global economy. While these can be characterized as temporary, they are not quite as temporary as expected. Semiconductor chip shortages and shipping disruptions have been persistent and widespread. Chip shortages have hampered auto production significantly, as the average new car has about 1400 semiconductor chips.

Source: Renaissance Macro Research, Haver Analytics
All market figures stated in this material are provided by Bloomberg.
Past performance is no guarantee of future results.
Cary Street Partners is the trade name used by Cary Street Partners LLC, Member FINRA/SIPC; Cary Street Partners Investment Advisory LLC and Cary Street Partners Asset Management LLC, registered investment advisers.
This information was prepared by or obtained from sources believed to be reliable, but Cary Street Partners does not guarantee its accuracy or completeness. Any opinions expressed or implied herein are subject to change without notice. The material has been prepared or is distributed solely for information purposes and is not a solicitation or an offer to buy any security or instrument or to participate in any trading strategy. An investor cannot invest directly in an index.
CSP2021180 © COPYRIGHT 2021 CARY STREET PARTNERS, ALL RIGHTS RESERVED