
|
|

- Markets rebounded in the second quarter following significant volatility, with the S&P 500 and major indices recovering losses as trade tensions eased.
- Growth and tech stocks led the gains in the second quarter, with international markets continuing to outperform U.S. stocks.
- The bond market saw shifting yields, with high-yield corporate bonds outperforming as credit spreads tightened.
- Tariffs have created policy-driven volatility, but so far have had a limited long-term impact on inflation or growth.
- The Fed remains on hold, with markets expecting gradual rate cuts starting later this year.
At the close of the second quarter, blissfully disconnected investors could glance at their portfolios and think the market strolled through the first half of 2025 at a respectable pace. Indeed, the S&P 500 Index is up 6.2% year-to-date, volatility is stable, and valuations are approximately where they started the year, at a forward price-to-earnings ratio of about 22x.1
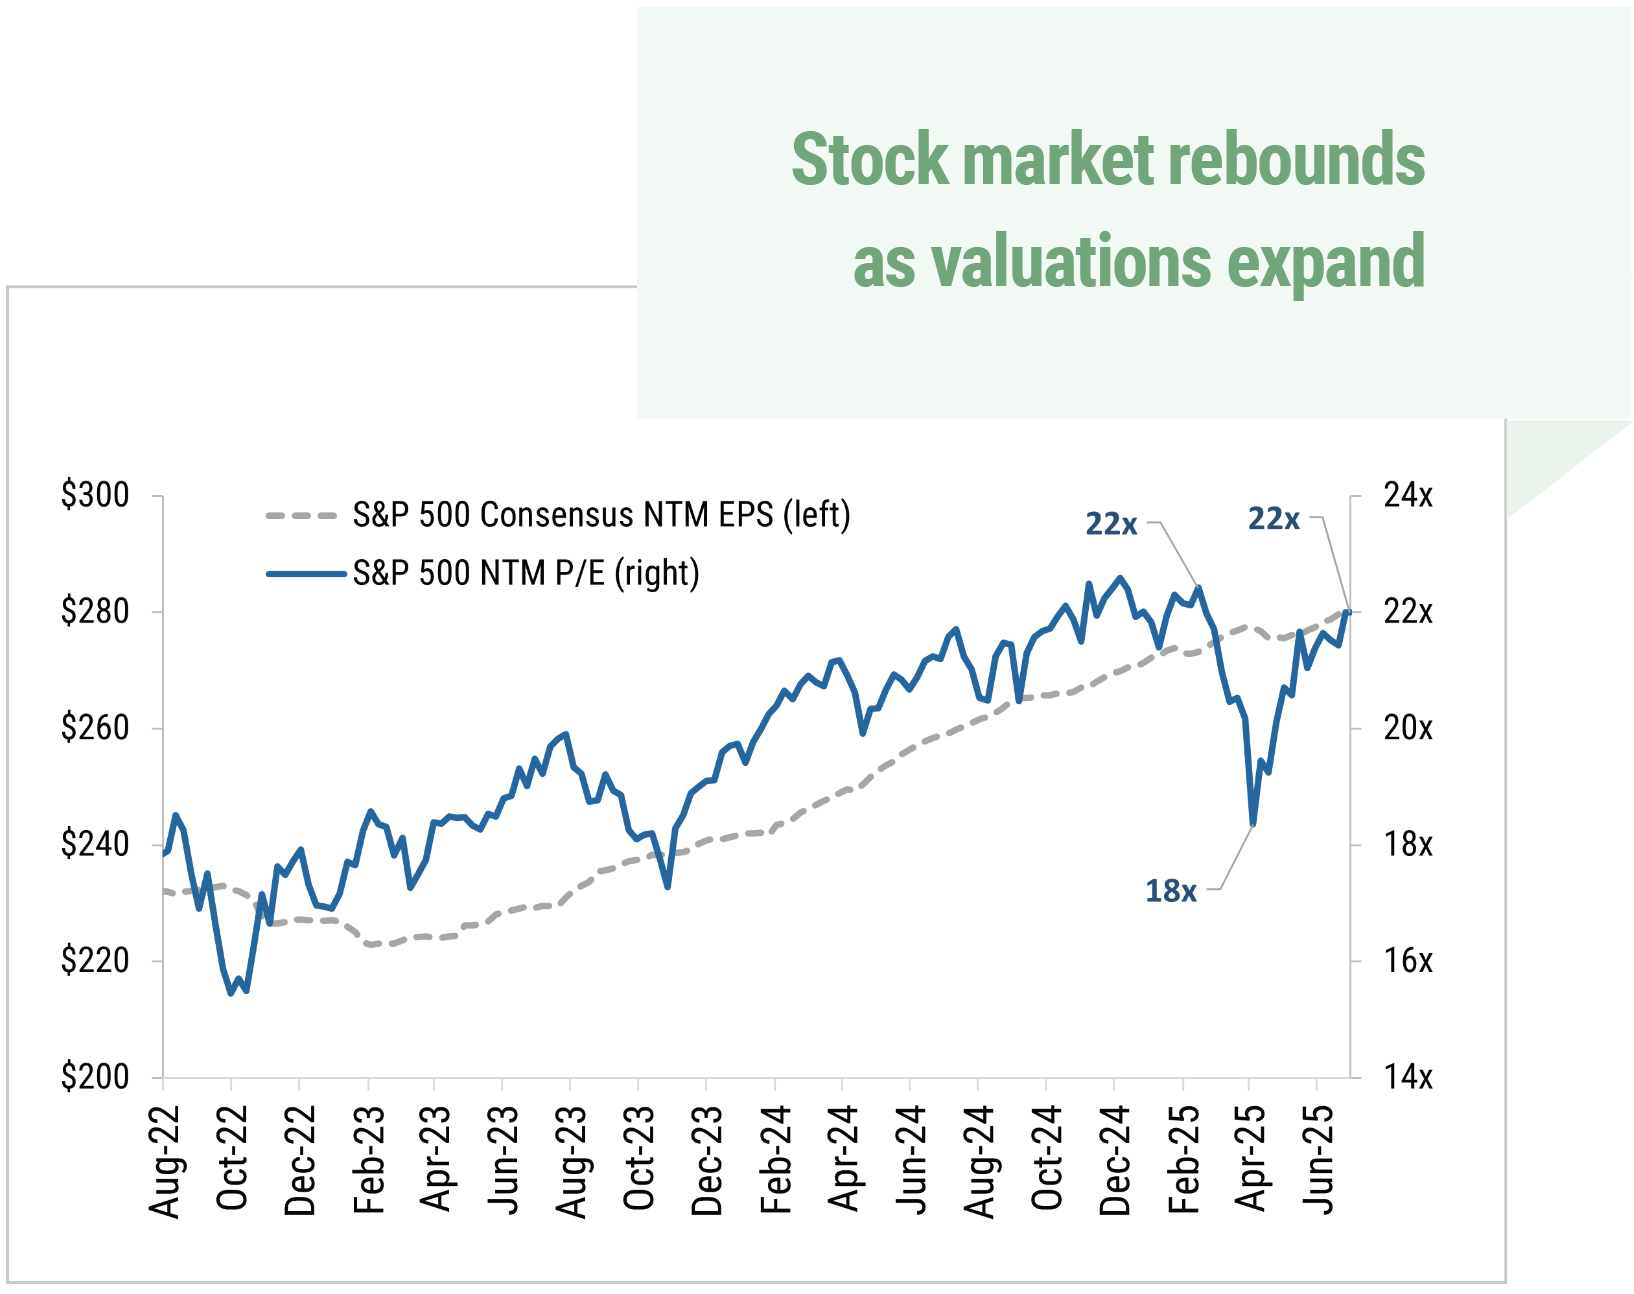
Source: Y Charts
Meanwhile, investors who tuned in to day-to-day market swings over the same period may still be unclenching their fingers following the second-quarter rollercoaster ride, which saw a volatility spike in April, along with a precipitous decline in the S&P 500, followed by a V-shaped recovery that drove the Index to a new record. With the coaster having arrived back at the station, the markets have proven resilient, but significant uncertainty remains. As the impacts of trade policy slowly make their way into the economy and corporate balance sheets, we are left to wonder what kind of ride the third quarter will bring.
Tech and Growth Stocks Drive a Stock Market Rebound
The S&P 500 entered the second quarter unsettled from the tariff announcements that began rolling out in February. As uncertainty increased, volatility ticked higher, and by the end of the first quarter, the Index was already down 8.7% from its February 19th peak. When the Trump Administration announced broader “Liberation Day” tariffs on April 2nd, stocks fell more sharply as investors fled risk assets. On April 8th, the S&P 500 closed at its lowest point for 2025, down nearly 19% from the February peak.2
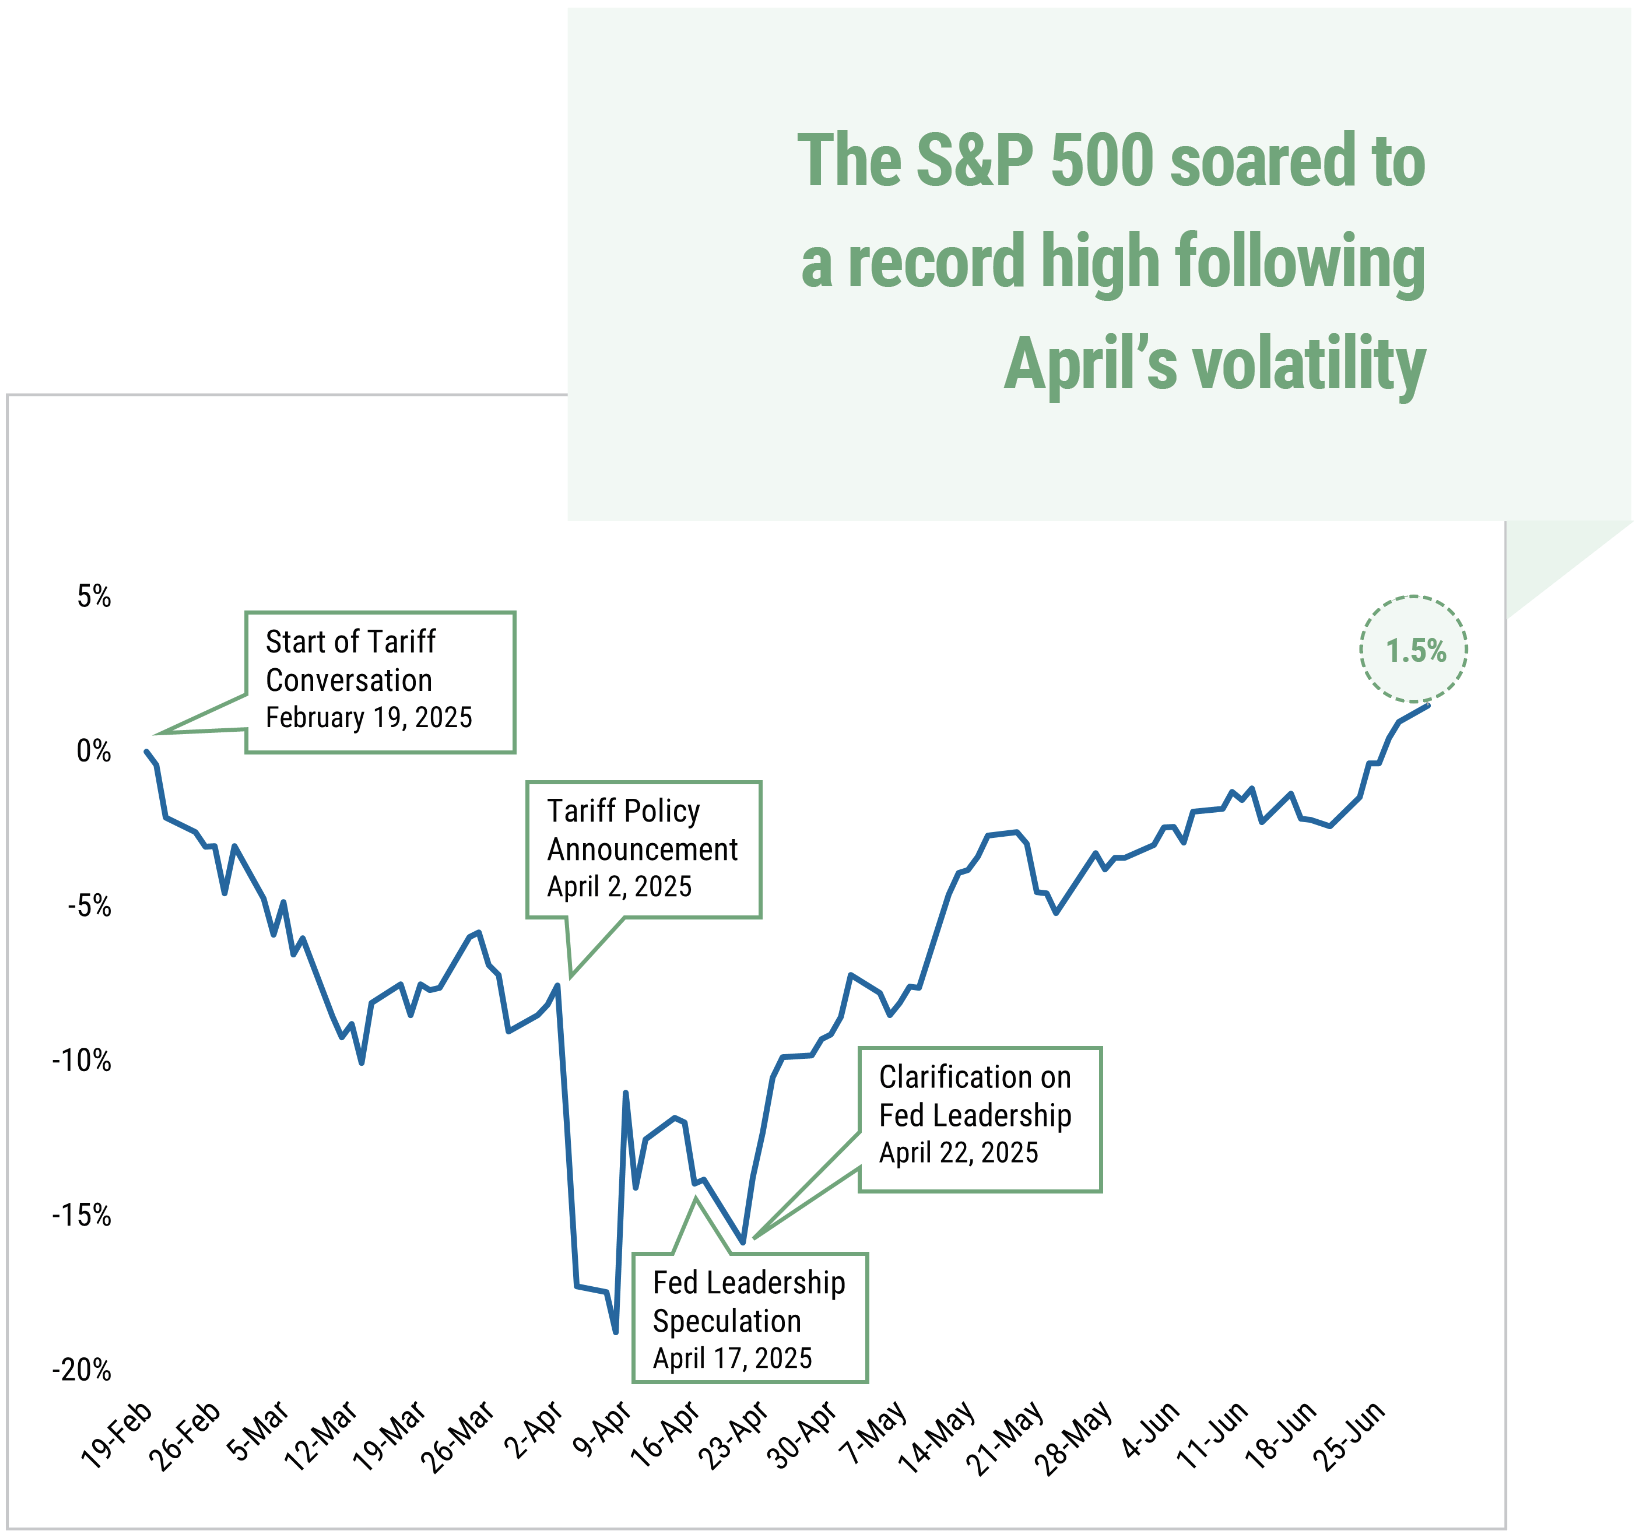 Source: Y Charts
Investor concerns about the potential negative impact of tariffs on corporate earnings, economic growth, and employment largely drove the April selloff. As the quarter progressed, however, those fears had not (yet) materialized. Stronger-than-expected first-quarter earnings began to emerge, inflation softened, and employment remained steady. The panic subsided. By late April, the markets had regained their footing, and by quarter-end, the S&P 500 had plotted a steady ascent, up 10.8% for the quarter.
After lagging in the first quarter, technology and growth stocks led the market during the second quarter, with the Nasdaq 100 Index up 17.9%, the “Magnificent Seven”5 stocks up 21%, and the Russell 1000 Growth Index up 17.8%. Meanwhile, defensive sectors that had outperformed during the first quarter trailed during the second quarter as investors rotated back into higher-risk assets.
One consistent theme from the first half of 2025 has been the outperformance of international stocks, driven by U.S. dollar weakness and a capital rotation from the United States into international markets. Developed markets, as represented by the MSCI EAFE, are up 19.5% year-to-date, while emerging markets are up 15.3% year-to-date as measured by the MSCI Emerging Markets Index. Both outperformed the S&P 500.3
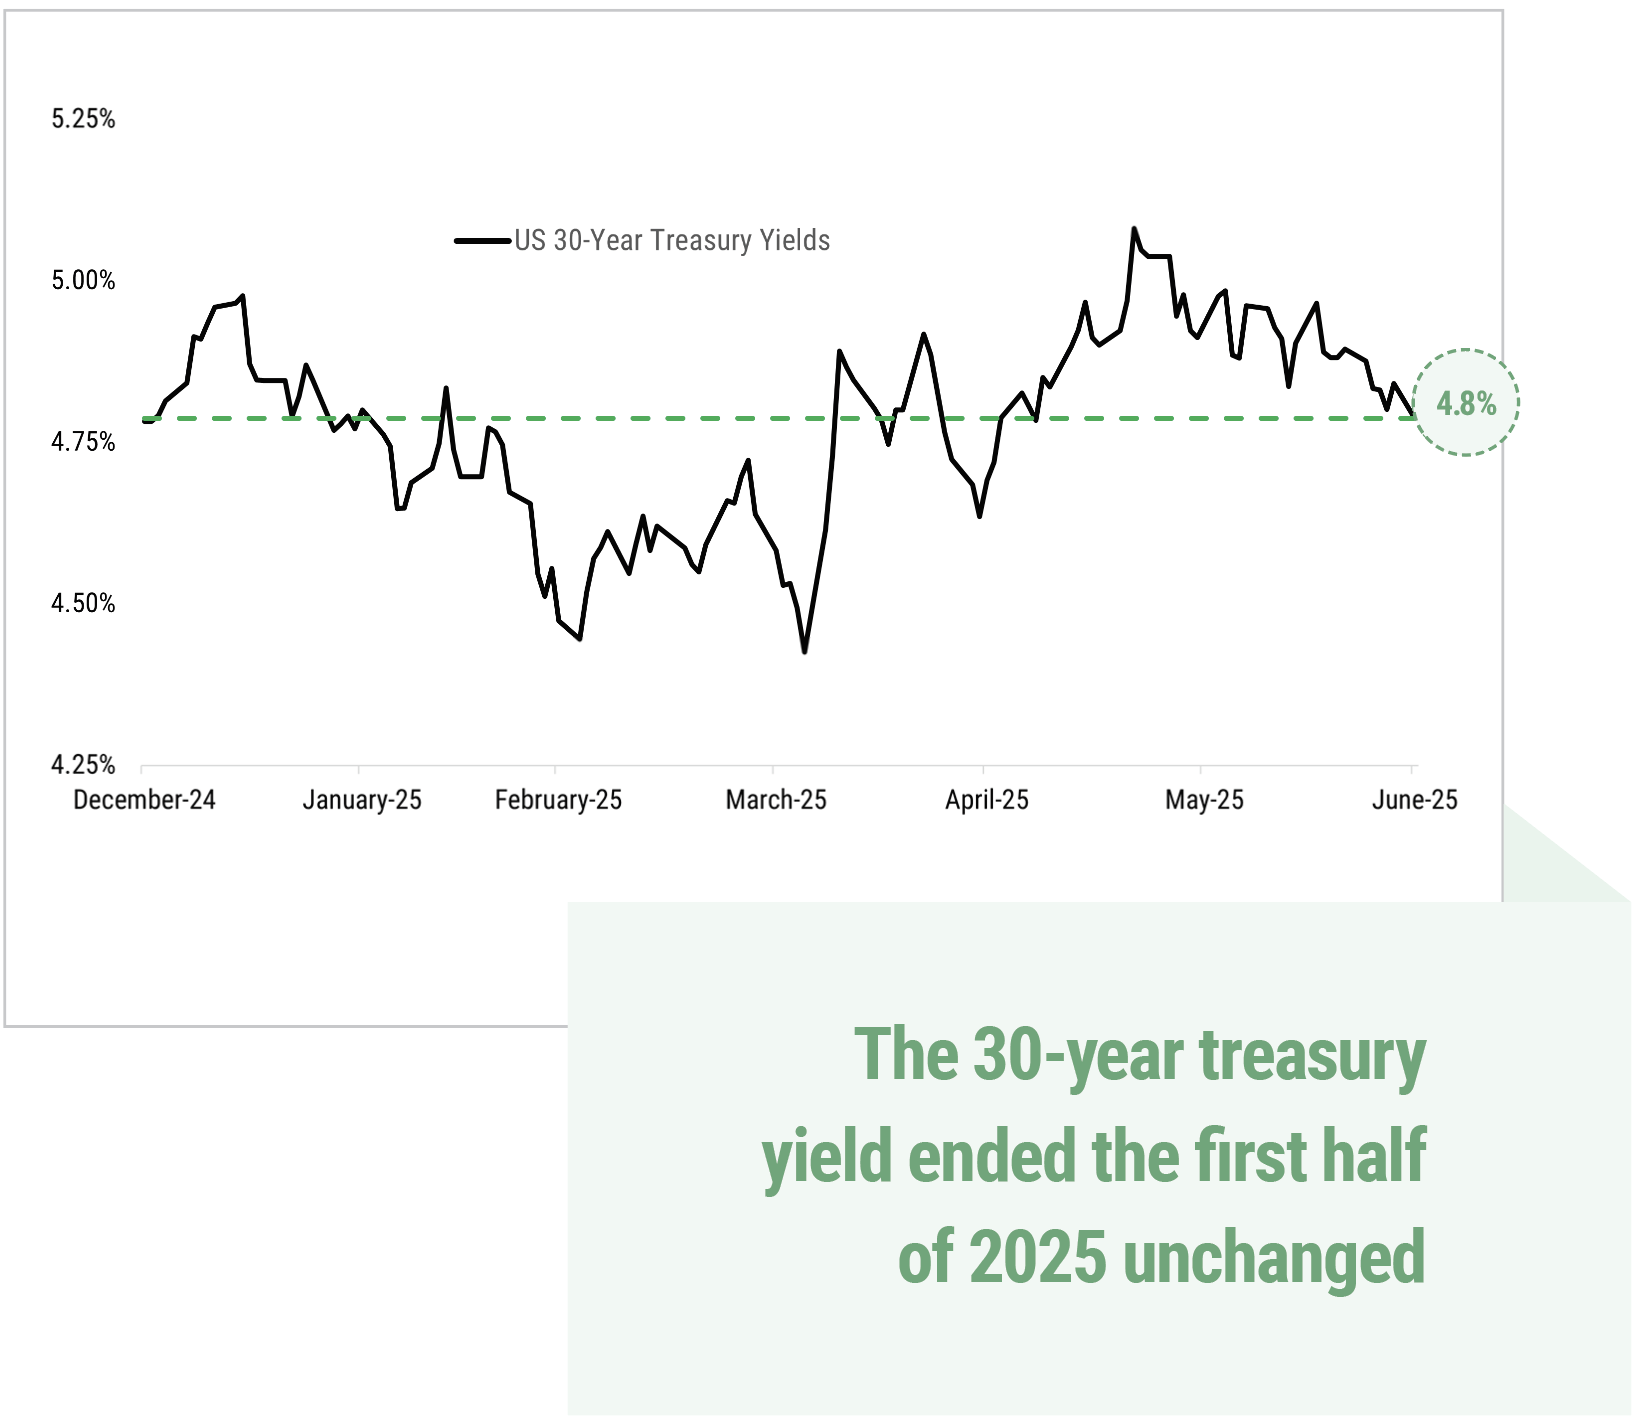
Shifting investor concerns about the potential for slower growth, inflation, and a growing fiscal deficit have been felt in fixed income, where the 30-year Treasury yield dipped from 4.80% to 4.40% during the first quarter, then rose to 5.10% in May before ending the second quarter approximately where it began the year, at 4.79%. As trade tensions eased and credit spreads tightened during the second quarter, high-yield corporate bonds outperformed investment-grade bonds.
Source: Y Charts
Economic Impact of Trade Policy and the Fed
Tariff announcements garnered headlines and created uncertainty during the first quarter, then peaked in early April with the “Liberation Day” tariffs. Since then, we’ve seen the temperature of the trade wars decline thanks to strategic retreats and negotiations with U.S. trading partners, including a trade agreement negotiated with China. De-escalating trade tensions helped financial markets recover during the second quarter. Still, significant uncertainty remains about the impact and future of tariffs, including the outcome of an appeal in the Court of International Trade regarding their legality.
The consensus has been that tariffs will slow U.S. growth and increase inflation. However, we haven’t yet seen these concerns materialize in the data. In March, tariff anticipation led U.S. consumers to front-load large-ticket purchases, such as cars, which increased first-quarter consumer goods imports and auto sales. This drove inflation higher in March, after which it ticked down rather than up in April, and remained muted in May. The debate continues about whether businesses will pass on tariff costs to consumers or absorb them to stay competitive. Even if consumers are forced to pick up the tab for businesses’ increased costs, it will likely provoke a short-term rather than long-term bump in inflation.
The Fed has maintained a cautious stance amid the uncertainty present in the first half of 2025, holding rates steady at 4.25%-4.50% and emphasizing that any decision to cut rates will be data-dependent. This cautious approach strikes a balance between concerns about potential tariff-driven inflation and risks to growth. If inflation remains muted and the growth and employment picture softens, it could pave the way for the Fed to cut rates. The current consensus is for gradual rate cuts totaling approximately 1.25% that will begin in September and continue through 2026.4
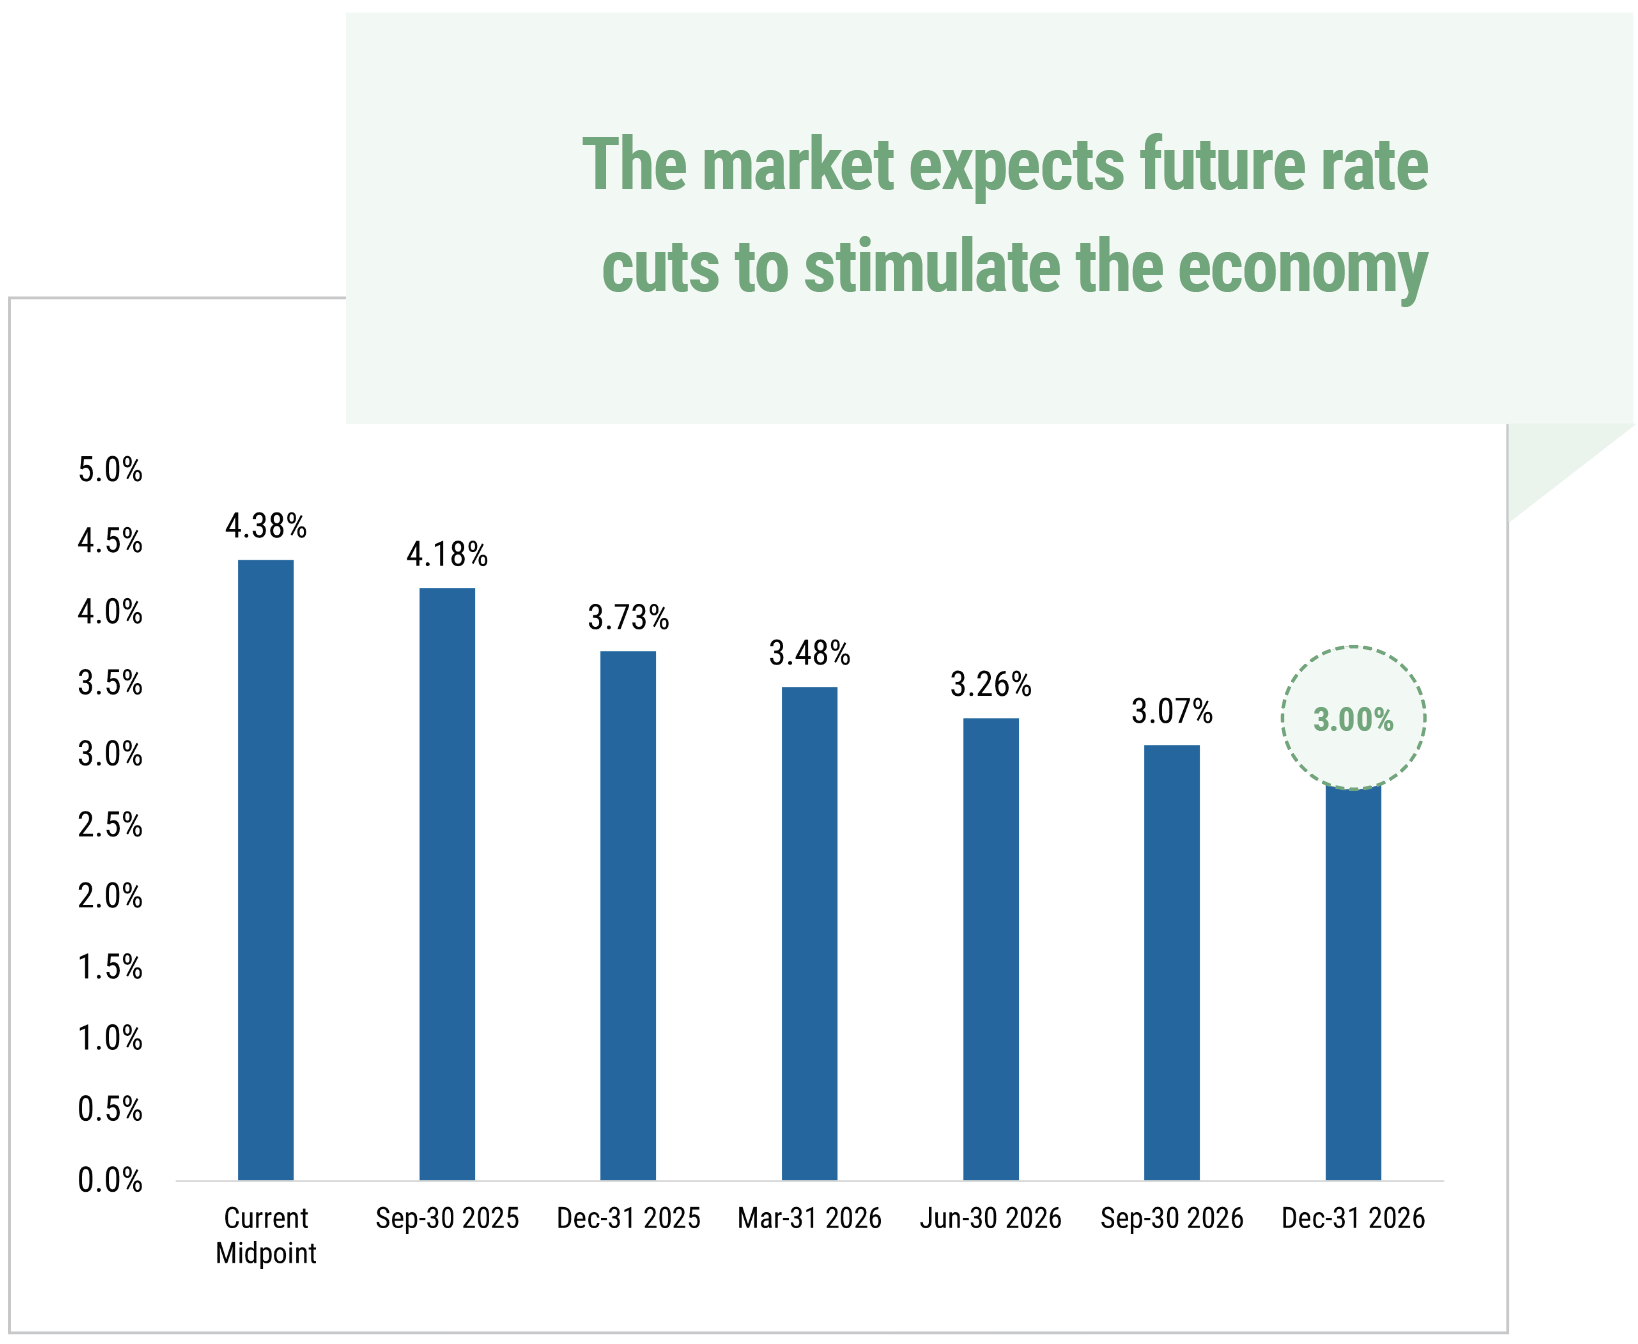 Source: CME
Remaining Focused Amid Volatility
Policy-driven volatility is likely to persist during the second half of 2025; however, the current consensus suggests we will see moderate economic growth and limited long-term tariff impacts. Accordingly, financial markets are striking a balance between optimism about growth and caution regarding potential outcomes. Upcoming economic data, earnings reports, and the release of second-quarter GDP will provide clarity on how trade developments are impacting the U.S. economy. We will monitor these developments, including key data such as consumer spending, manufacturing activity, labor market trends, and inflation readings.
While market volatility can be challenging, it is a normal part of equity investing. History has shown that how investors respond to volatility can endanger portfolios more than the volatility itself.Staying invested and focusing on a diversified, long-term strategy that aligns your portfolio with your long-term objectives remains a prudent and time-tested approach.
1 Morningstar
2 Y Charts
3 Morningstar
4 CME Group
5 “Magnificent Seven” refers to a group of seven high-performing, influential stocks in the technology sector. Alphabet (GOOGL; GOOG), Amazon (AMZN), Apple (AAPL), Meta Platforms (META), Microsoft (MSFT), NVIDIA (NVDA), and Broadcom (AVGO)
All market performance figures are for the period ending 7/3/2025.
Cary Street Partners is the trade name used by Cary Street Partners LLC, Member FINRA/SIPC; Cary Street Partners Investment Advisory LLC and Cary Street Partners Asset Management LLC, registered investment advisers. Registration does not imply a certain level of skill or training.
Any opinions expressed here are those of the authors, and such statements or opinions do not necessarily represent the opinions of Cary Street Partners. These are statements of judgment as of a certain date and are subject to future change without notice. Future predictions are subject to certain risks and uncertainties, which could cause actual results to differ from those currently anticipated or projected.
We undertake no duty or obligation to publicly update or revise the information contained in this letter. In addition, information related to past performance, while helpful as an evaluative tool, is not necessarily indicative of future results, the achievement of which cannot be assured. You should not view the past performance of securities, or information about the market, as indicative of future results.
Cary Street Partners is a broker-dealer and registered investment adviser and does not provide tax or legal advice; no one should act upon any tax or legal information herein without consulting a tax professional or an attorney.
International and foreign securities are subject to additional risks such as currency fluctuations, political instability, differing financial standards, and the potential for illiquid markets.
Fixed income investments have several other asset-class specific risks. Inflation risk reduces the real value of such investments, as purchasing power declines on nominal dollars that are received as principal and interest. Interest rate risk comes from a rise in interest rates that causes a fixed income security to decline in price in order to make the market price-based yield competitive with the prevailing interest rate climate. Fixed income securities are also at risk of issuer default or the markets’ perception that default risk has increased.
Comparative Index Descriptions: Historical performance results for investment indices have been provided for general comparison purposes only, and generally do not reflect the deduction of transaction or custodial charges, the deduction of an investment management fee, nor the impact of taxes, the incurrence of which would have the effect of decreasing historical performance results. It should not be assumed that your account holdings do or will correspond directly to any comparative indices. An investor cannot invest directly in the indices shown, and accurate mirroring of the indices is not possible.
The Standard & Poor’s (S&P) 500 Index is an index of 500 stocks seen as a leading indicator of U.S. equities and a reflection of the performance of the large cap universe, made up of companies selected by economists. The S&P 500 is a market value weighted index and one of the common benchmarks for the U.S. stock market.
The Russell 1000® Growth Index measures the performance of the largecap growth segment of the US equity universe. It includes those Russell 1000 companies with relatively higher price-to-book ratios, higher I/B/E/S forecast medium term (2 year) growth and higher sales per share historical growth (5 years). The Russell 1000® Growth Index is constructed to provide a comprehensive and unbiased barometer for the large-cap growth segment. The index is completely reconstituted annually to ensure new and growing equities are included and that the represented companies continue to reflect growth characteristics.
The MSCI EAFE Index is a stock market index that measures the performance of large- and mid-cap companies across 21 developed markets countries around the world. Canada and the USA are not included. EAFE is an acronym that stands for Europe, Australasia, and the Far East.
The MSCI Emerging Markets is a global stock market index that tracks the performance of large and mid-cap companies across 24 emerging markets. It is maintained by MSCI, formerly Morgan Stanley Capital International, and is used as a common benchmark for global emerging market stock funds.
The Nasdaq-100 Index is a “modified capitalization-weighted” index designed to track the performance of a market consisting of the 100 largest and most actively traded non-financial domestic and international securities listed on The Nasdaq Stock Market, based on market capitalization.
The Bloomberg Barclays US Aggregate Bond Index (US Agg Bond) is a market capitalization weighted index, meaning the securities in the index are weighted according to the market size of each bond type. Most US traded investment grade bonds are represented. Municipal bonds and Treasury Inflation-Protected Securities are excluded due to tax treatment issues. The index includes Treasury securities, Government agency bonds, mortgage-backed bonds, corporate bonds, and a small number of foreign bonds traded in the US.
